News & Fundamental
This week was a special week because Satoshi Nakamoto’s Bitcoin whitepaper celebrated its 13th birthday; it has been 13 years since a 9-page whitepaper was released and changed the world. It needs to be mentioned that the Bitcoin network and cryptocurrency have grown to exceptional levels since.
MicroStrategy CEO Michael Saylor revealed that MicroStrategy has added nearly 9,000 BTC to its holdings during Q3 and has made a gain of more than 500% on its holdings over the past year. MicroStrategy’s 17,732 BTC holdings are now worth $1.1B.
Following Facebook’s (now Meta’s) announcement on Thursday, the prices of crypto Metaverse tokens are soaring as much as 100%, and they have been in a bullish rally since. Metaverse token MANA is up 100%, while SAND climbed 35%.
El Salvador’s government plans to build 20 ‘Bitcoin Schools’ using the “surplus” from its Bitcoin Trust account, aiming to enhance cryptocurrency education, according to the Press Secretary of the Presidency’s recent tweet.
Australia’s largest bank, Commonwealth, enables buying, selling, and holding Bitcoin and other cryptocurrencies for 6.5m customers through the bank’s app. As they said, customers will have access to 10 digital assets, including bitcoin, ether, bitcoin cash, and Litecoin.
Eric Adams, New York’s newly elected mayor, is starting his new political role with the full support of Bitcoin and cryptocurrencies. He has confirmed that he will accept his first three paychecks in Bitcoin and has promised to make NYC the center of crypto.
Google has invested $1B in Bitcoin Futures provider CME Group, the futures-exchange giant that offers regulated bitcoin services, aiming to transfer CME’s core trading systems to the cloud.
Brazil is considering a new law to allow all workers to be paid in Bitcoin. A draft bill seeking to allow Brazilian workers to get paid in Bitcoin was presented to the country’s Deputies Chamber on November 5.
Onchain Analysis
Exchanges Reserves (update)
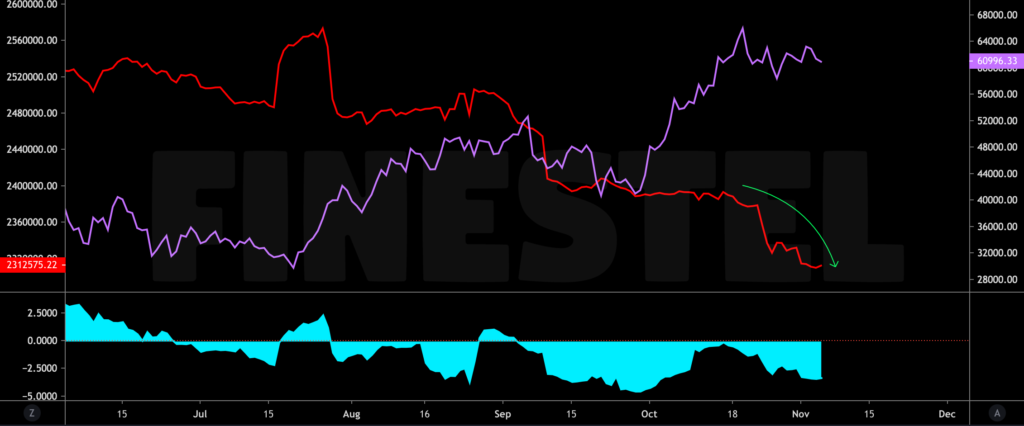
The chart above shows Bitcoin’s price with All Exchanges Reserves and its 30-Day Rate of Change. Bitcoin reserves are in a powerful downtrend and have reached new all-time lows. Bitcoins being withdrawn from exchanges continuously suggests that a great accumulation phase has been going on, which can affect price in the long-term view.
Network’s Transaction Count
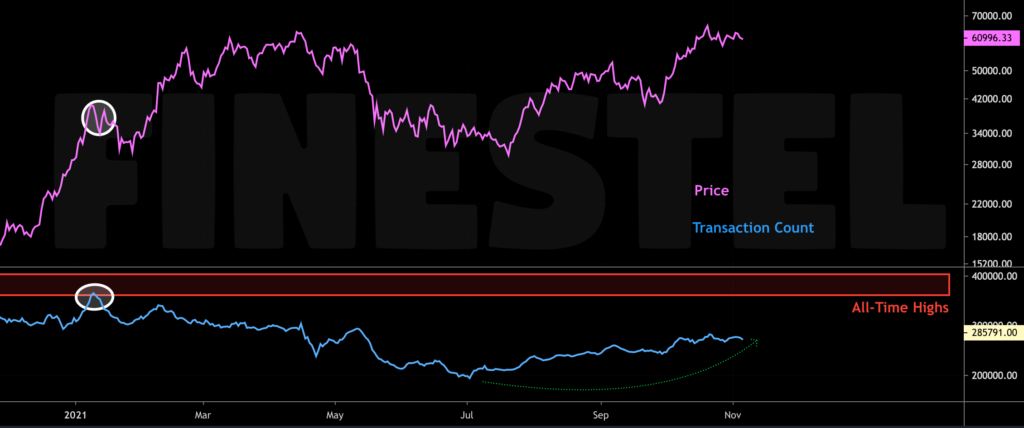
In this chart, you can see the price with the Network’s Transaction Count per day. After the major crash in May, Bitcoin’s onchain activity had been decreasing to lower levels till July, which we can conclude from the transaction count indicator in the chart. But since the price started to recover itself and began a bullish rally, the total number of onchain transactions has been in an uptrend. Normally in bull runs, we have to see more onchain activity and a greater number of transactions per day. Hence, right now, the network’s activity isn’t high enough and is far below its prior high when Bitcoin reached $42,000 for the first time.
Exchange Whale Ratio
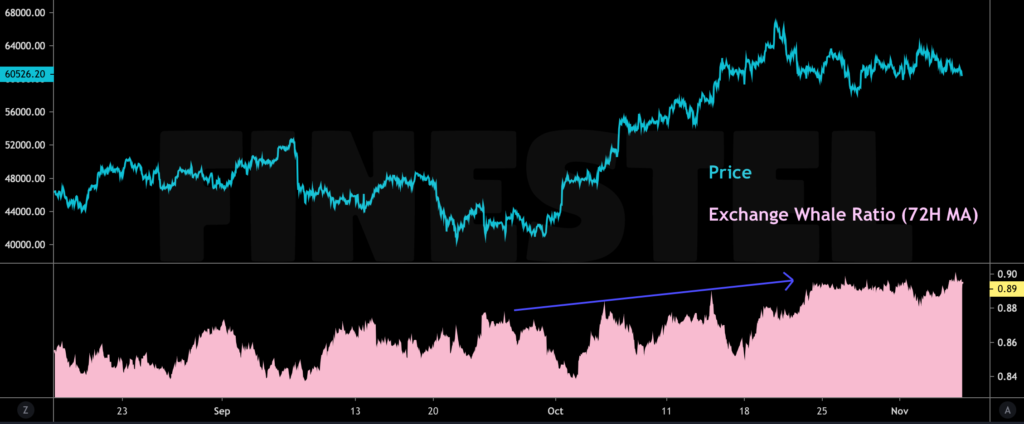
The Exchange Whale Ratio is the total BTC amount of the top 10 transactions (in terms of total BTC sent) divided by the total BTC amount flowing into exchanges. As it is clear, the top 10 deposit transactions into exchanges have taken almost 90% of the total volume in an hour for a couple of days. It shows that whale activity has grown, and they are sending BTC to their exchanges either to sell and save profits or to arbitrage. But as you can witness, the $60K support zone has been doing well and has been holding the price above $60,000 despite whale dumping.
Long-Term Holder’s SOPR
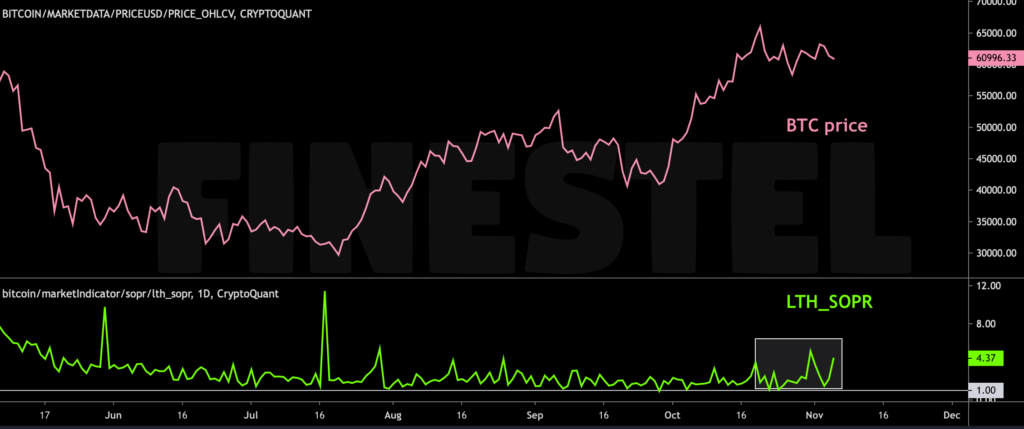
To see the effect of the Whale ratio going up, we can check the LTH-SOPR metric to see if long-term holders are realizing profits or averagely moving their coins in profit or not. We can see that when the price reached a new ATH, the LTH-SOPR has been in an uptrend in general and has made local tops which shows that they have realized some of their profits but nothing to be worried about. Usually, this behavior is common in bull runs and may lead to a short-term price correction.
Sum Coins Age Distribution
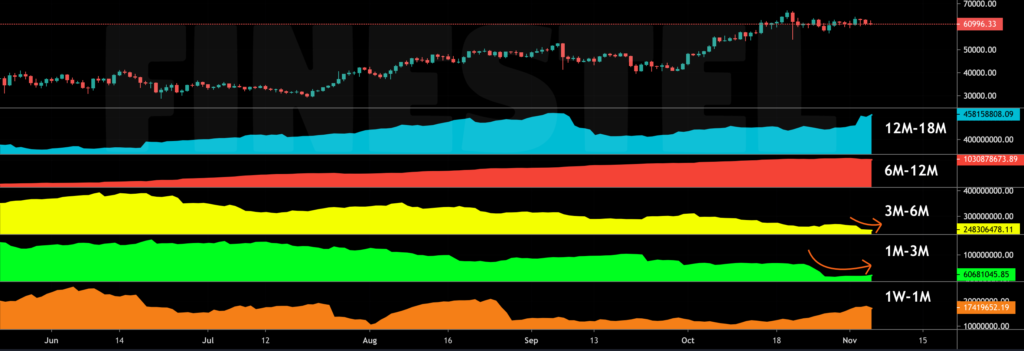
Sum Coin Age Distribution (SCA Distribution) shows the distribution of Long-Term Holder and Short-Term Holder with UTXO data, and it is weighted by busy days (=age of each UTxO) to highlight long-term holder’s distribution. As the chart represents, we can say that the 1M-3M and 3M-6M holders group are taking some of their profits and distributing just a bit, which is not a bad sign, and it is a normal behavior of holders during the run.
Technical Analysis
Weekly Chart
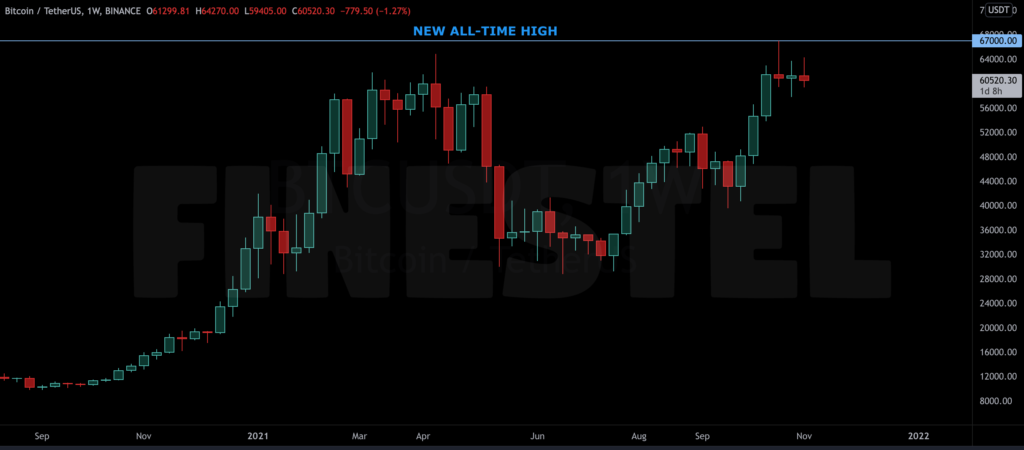
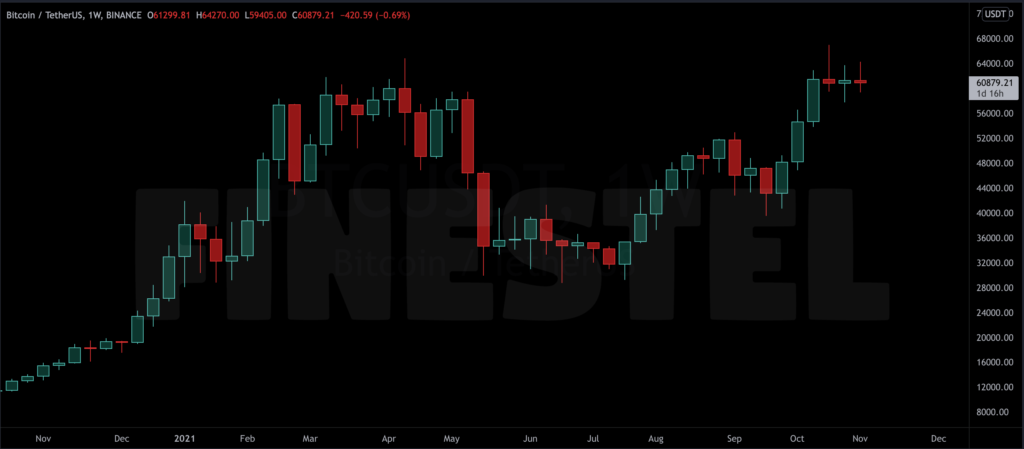
Bitcoin has been in a consolidation phase for almost three weeks after it reached its prior ATH. As shown, the upside momentum is slowing, indicating that this consolidation phase could persist in the short term. This week’s candle is closing in the form of a Doji bar, the same as the last two weekly candles.
Daily Chart
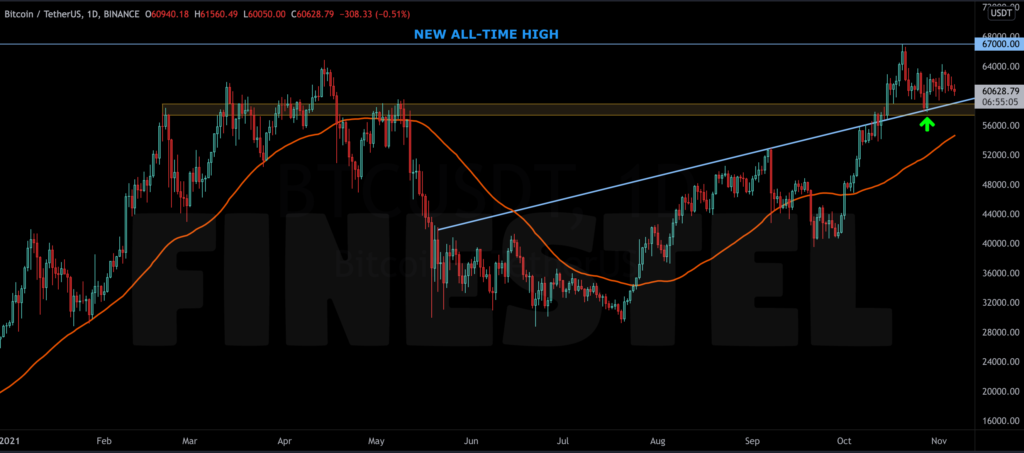
Despite dipping below $60,000 once more, the support zone has done well, and the price has bounced off and reclaimed the $60,000 zone and continues to trade in a tight range between $60K and $64K. The only resistance ahead is the $65-$67K zone, which if BTC breaks this level, we can expect a sharp move toward $70K soon.
As you saw in the onchain analysis section, whales and big players were dumping the price, and bears were stepping up and pushing it south too. If buyers/bulls fail to hold the $60,000 zone, the lower support level is near the 50-day moving average, currently around $55,000.
The average sentiment of the market is bullish, but we may see a short-term consolidation/range in the price and a sharp bullish leg soon after that, which will lead the price to new ATHs.
BNB
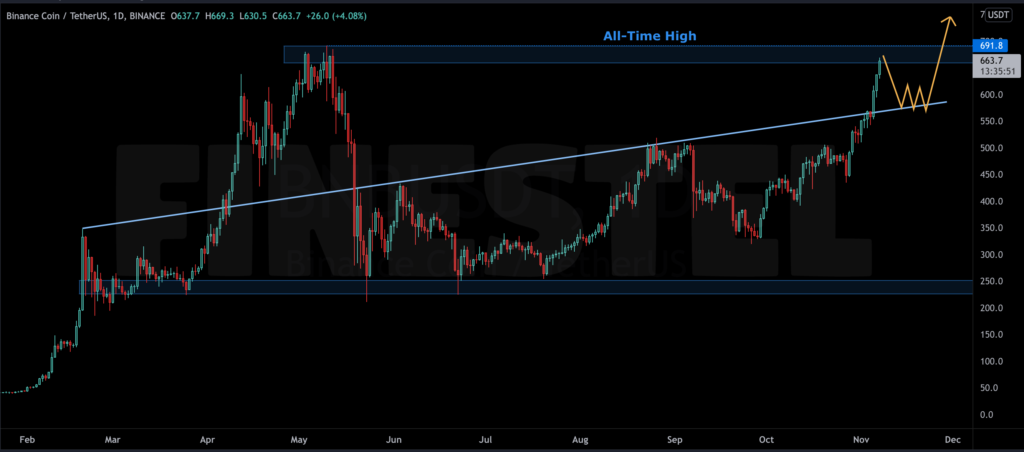
BNB has been rising impulsively towards its all-time high after experiencing a massive 70% correction during the market crash. It seems logical for BNB to be the next large-cap to its ATH, following BTC and ETH. As you can witness on the chart above, the price has broken the ascending trendline with huge momentum and is currently in a key area in terms of price action, which is the previous ATH level. Now, we can expect two bullish scenarios. Price can see a retracement from here, completing a pullback to the broken trendline and then, continue to break the ATH and rally towards a higher level. Or it can break this major resistance and make consolidation and a potential pullback to the broken level, then rise towards higher targets. Both of these scenarios are based on Bitcoin continuing its bull run and conserving the market’s current bullish sentiment.


Leave a Reply