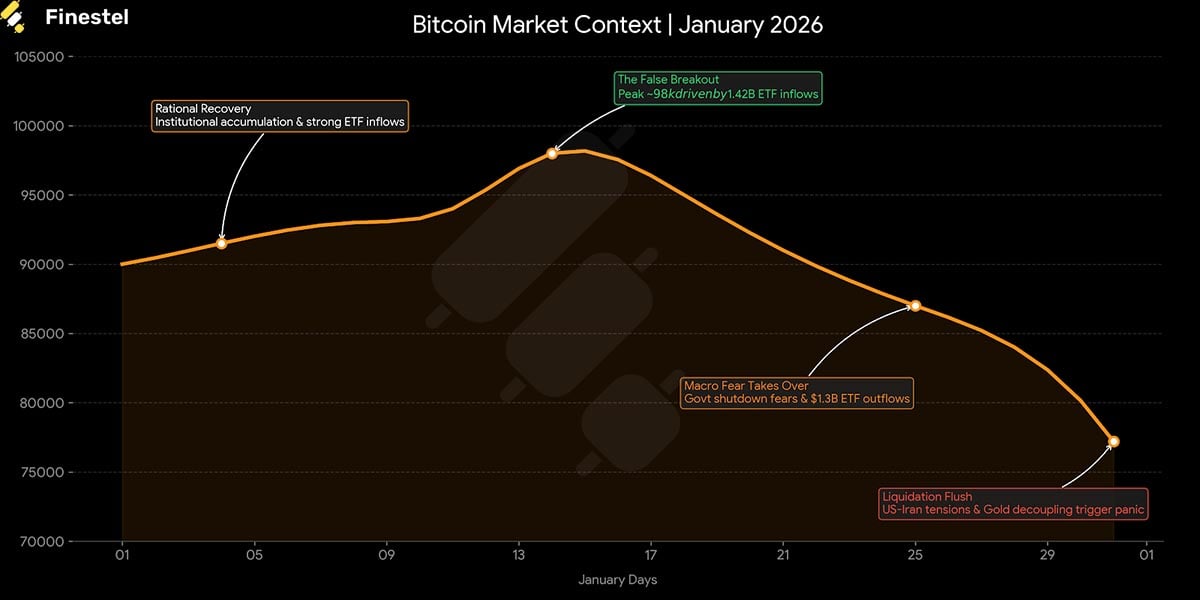
The January 2026 crypto market report will be etched in market history as the month the “Digital Gold” narrative faced its harshest stress test, and failed. The year opened with a textbook “Rational Recovery” setup: post-QT liquidity was flowing, and institutional allocations pushed Bitcoin to reclaim the $90,000 threshold. For the first two weeks, the thesis appeared pristine as the asset tested $98,000 amidst massive ETF inflows.
Then, the narrative broke.
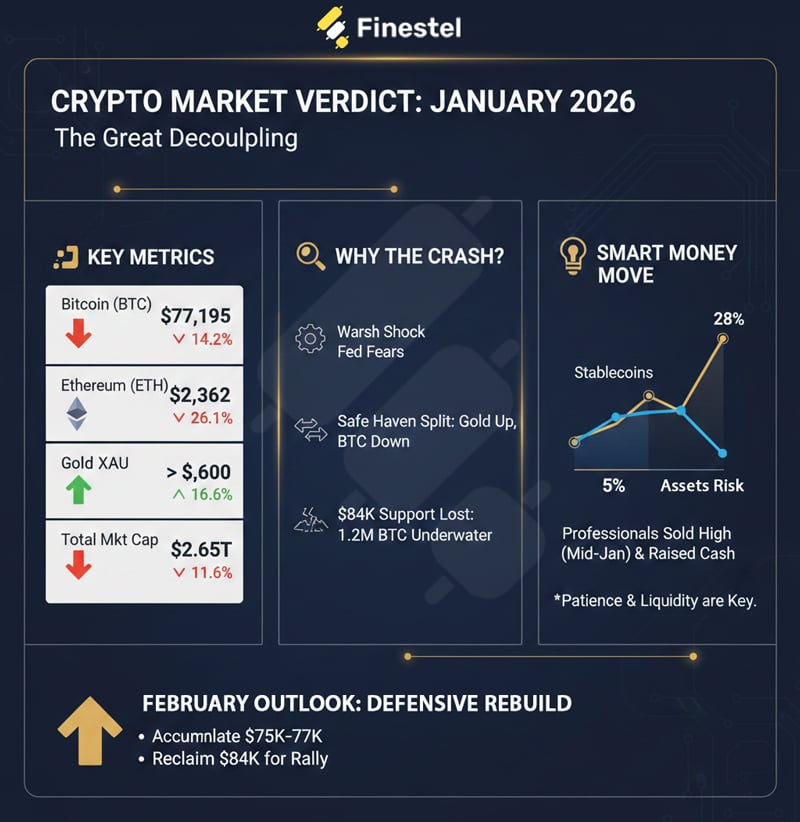
As geopolitical tensions with Iran escalated and “Black Swan” fears regarding a U.S. government shutdown intensified, the market witnessed a violent Decoupling Event. Gold behaved exactly as a safe haven should, surging to unprecedented highs above $5,600. Bitcoin, conversely, was treated by global macro markets as a high-beta risk asset, plunging alongside the tech sector. The month concluded with a severe “Liquidation Flush,” erasing all gains to close Bitcoin near $77,195 and Ethereum at $2,362.
Yet, amid the retail panic, Kucoin and Finestel’s proprietary insider data reveals a different story: Professional asset managers didn’t panic; they prepared. Our data shows a defensive pivot began two weeks before the crash, preserving capital while the crowd chased the top.
Macro Economy: The “Hot Money” Head-Fake
The “Warsh Shock” (The Real Catalyst): The narrative fractured on January 16 when Kevin Hassett; the market’s favorite for aggressive rate cuts, withdrew from the race. Simultaneously, Kevin Warsh surged as the frontrunner.

The Fear: Unlike Hassett, Warsh is historically a “Hard Money” advocate who has previously called Quantitative Easing (QE) “Reverse Robin Hood.”
The Reaction: The market instantly repriced the probability of “Trump QE” from High to Near Zero. Investors realized that a Warsh-led Fed might prioritize sound money over pumping asset prices.
When this reality set in, compounded by US-Iran tensions, the “hot money” fled. We witnessed $1.33 billion in outflows in Week 4. The definitive signal was the breakdown in correlation: on Jan 29, as Gold broke $5,500, Bitcoin failed to follow, confirming that without the promise of loose Fed liquidity, crypto lost its immediate “risk-on” bid.
The Month in Numbers
The divergence was stark: Gold rallied 16% while Crypto collapsed, confirming a risk-off correlation breakdown.
|
Asset Class |
Start of Month (Jan 1) |
Mid-Month Peak (Jan 14-15) |
End of Month (Jan 31) |
Monthly Change |
Verdict |
|
Bitcoin (BTC) |
~$90,000 |
~$98,000 |
~$77,195 |
▼ 14.2% |
Liquidity Flush |
|
Ethereum (ETH) |
~$3,200 |
~$3,018 |
~$2,362 |
▼ 26.1% |
Structural Breakdown |
|
Gold (XAU) |
~$4,800 |
~$5,000 |
>$5,600 |
▲ 16.6% |
True Safe Haven |
|
Total Mkt Cap |
$3.00T |
$3.45T |
$2.65T |
▼ 11.6% |
Leverage Reset |
Bitcoin ($BTC): The Cost Basis Capitulation
The defining technical event of January 2026 was not the volatility itself, but the violation of market structure. For months, the $84,000 level served as the impenetrable floor, mathematically representing the Short-Term Holder (STH) Realized Price. This is the average price at which recent entrants acquired their coins. In a bull market, this level acts as high-conviction support; losing it signals a regime change.
- The “Underwater” Wall: The breach of $84,000 was a catastrophic signal. By closing the month at $77,195, the market has effectively trapped 1.2 million BTC in an unrealized loss position. This supply, previously held by confident buyers, has now converted into “overhead resistance.” Any relief rally toward $80k–$84k is likely to be met with aggressive selling pressure as these underwater holders look to break even and exit.
- The Bearish Flip: As warned in Report 177, $84k was the “line in the sand.” The breakdown has technically invalidated the Q4 2025 bullish trend. We are no longer in a “buy the dip” environment; until proven otherwise, we have entered a “sell the rip” structure.
- The Danger Zone: The close at $77,195 leaves Bitcoin in a precarious vacuum. There is thin volume support between here and the 2025 breakout zones ($72k–$68k). Bulls must reclaim $80,000 immediately in early February to prove this was a liquidity deviation rather than a trend reversal.
|
Metric |
Value |
Implication |
|
Jan Close |
$77,195 |
Bearish engulfing candle. |
|
Key Resistance |
$84,000 |
Massive overhead supply (1.2M BTC). |
|
Critical Support |
$75,000 |
Must-hold level to prevent flush to $68k. |
Ethereum ($ETH): The Utility Trap
Ethereum’s performance in January confirmed its status as the “weak link” in the current cycle. While Bitcoin struggled with macro headwinds, Ethereum struggled with an identity crisis. The asset ended the month down 26%, with the ETH/BTC ratio collapsing to fresh multi-year lows, signaling a complete loss of dominance against the market leader.
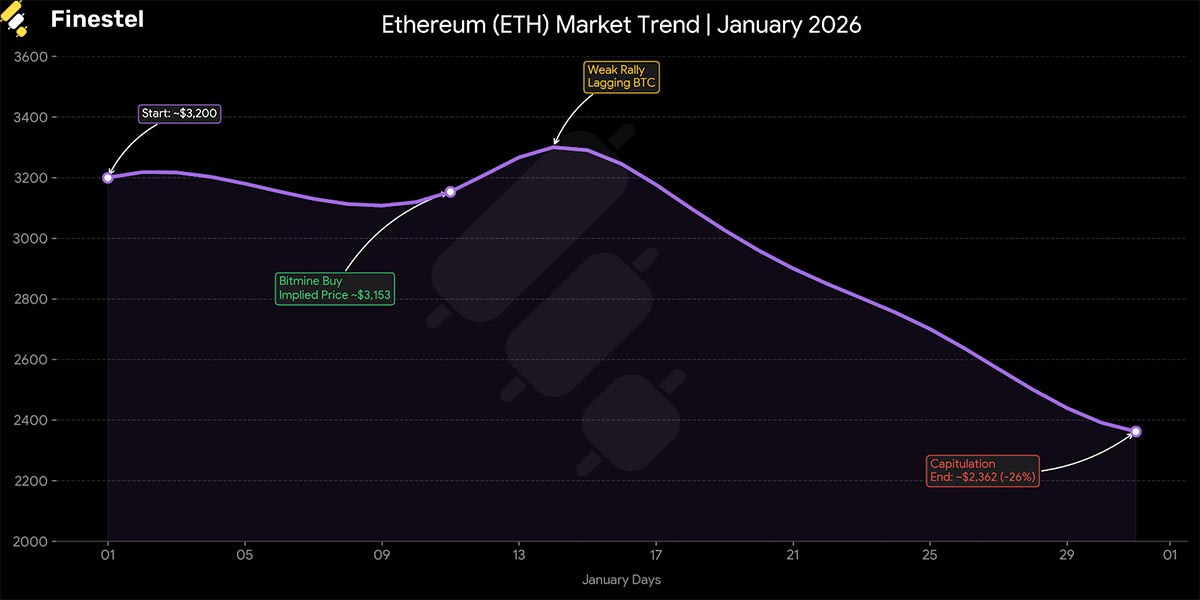
- Institutional Buying vs. Price Action: The most alarming divergence occurred in the institutional sector. Early in the month, corporate treasury Bitmine executed a high-conviction purchase of 32,977 ETH (~$104M). In a healthy market, a nine-figure buy wall would front-run a rally. In January, the market absorbed this liquidity and continued to dump. When fundamentals (corporate buying) are ignored in favor of panic selling, it indicates extreme sentiment exhaustion.
- The Structural Breakdown: The failure to hold the $2,900 support level was the technical nail in the coffin. This level represented the post-Merge accumulation zone. Losing it opens the door to lower volatility targets in the $2,200 region.
- The “Squeeze” Narrative: Ethereum is currently being squeezed from both sides. It is losing the “Store of Value” argument to Bitcoin and the “High-Performance Tech” argument to Solana ($SOL) and its own Layer-2 ecosystem. As L2s capture the revenue and activity, the value accrual to the mainnet token ($ETH) is being questioned by the market, weighing heavily on price action.
|
Metric |
Data Point |
Verdict |
|
Institutional Flow |
+$104M (Bitmine Buy) |
Ignored by Market (Bearish) |
|
Technical Damage |
Lost $2,900 Support |
Breakdown Confirmed |
|
Relative Strength |
ETH/BTC Ratio |
Multi-Year Lows |
On-Chain Forensics: The Leverage Flush
The blockchain reveals a market in the midst of a violent reset. The Net Unrealized Profit/Loss (NUPL) indicator dropped from “Euphoria” directly to “Anxiety” in just five days.

The Capitulation: Short-Term Holders (STHs) capitulated en masse, realizing losses of approximately $400 million per day during the drop to $77,000.
The Liquidation: January 31 saw $2.53 billion in liquidations, 88% of which were Long positions.
The Silver Lining: This leverage flush was absolute. Open Interest (OI) is down 25%, and funding rates have flipped negative. Historically, when STHs panic-sell to Long-Term Holders (LTHs) at this magnitude, a local bottom is often near.
Smart Money Follow-Up: Who Bought the Blood?
While ETF investors (The “Paper Hands”) fled, corporate treasuries (The “Diamond Hands”) went shopping.
- MicroStrategy: Continued its programmatic accumulation, adding 1,287 BTC during the dip.
- BitMine: Aggressively staked 44,463 ETH and added 925 SOL, signaling long-term conviction in the ecosystem despite price volatility.
- The Verdict: The transfer of wealth from weak ETF hands to strong corporate balance sheets suggests the long-term thesis remains intact despite the monthly candle’s ugliness.
Regulations: The Silent Catalyst
Amid the noise of price action, the structural foundation of the crypto market quietly strengthened in January. While immediate market movements were dictated by macroeconomic volatility, the long-term regulatory landscape shifted decisively in favor of institutional integration and asset legitimacy.

United States: The Strategic Pivot
The legislative environment in the U.S. remains complex but increasingly optimistic. The highly anticipated “Crypto Market Structure Bill” (CLARITY Act) faced a temporary setback, with the Senate Agriculture Committee rescheduling its hearing to January 27. The delay was largely driven by banking industry opposition regarding stablecoin yields and the competitive threat to traditional deposits.
However, this legislative stall was overshadowed by a massive executive signal: the White House has officially prioritized the framework for a “Bitcoin Strategic Reserve”. Treasury Secretary Steven Mnuchin reiterated President Trump’s goal to establish the U.S. as the “global capital of cryptocurrency,” a directive that includes halting the sale of confiscated Bitcoin and integrating it into national reserves. This pivot from enforcement to accumulation represents a historic tailwind for the asset class.
Global Wins: Standardization and Protection
Beyond the U.S., major Asian economies are accelerating their regulatory clarity to attract capital. Japan released its 2026 tax reform blueprint, proposing a significant reduction in the tax rate for cryptocurrencies to a uniform 20%, a move designed to encourage retail participation and corporate holding.
Simultaneously, South Korea has moved to institutionalize the sector by lifting a nine-year ban that prevented listed companies from investing in cryptocurrencies. The country is also fortifying its market structure with the “Basic Act on Digital Assets,” which introduces new protections for stablecoin users and bankruptcy remoteness mechanisms, ensuring that the next wave of adoption is built on a safer foundation.
Privacy Sector: A Regulatory Thaw
The regulatory tone toward privacy and decentralized protocols is showing signs of a critical shift. With the departure of the last Democratic commissioner from the SEC, the agency is under full Republican control, fostering expectations of a “pro-crypto” regulatory regime. This environment has breathed new life into the privacy sector, which had previously been under existential threat.
Legislative moves like the “Blockchain Regulatory Certainty Act,” supported by lawmakers from both parties, aim to exempt DeFi developers from certain financial regulations. This softening stance has allowed privacy-focused assets like $NIGHT to decouple from the general market bleed, outperforming broader indices as investors price in a future where privacy technology can coexist with compliance.
Risk & Value-at-Risk (VaR) Analysis
This chart visualizes the dramatic shift in market character:
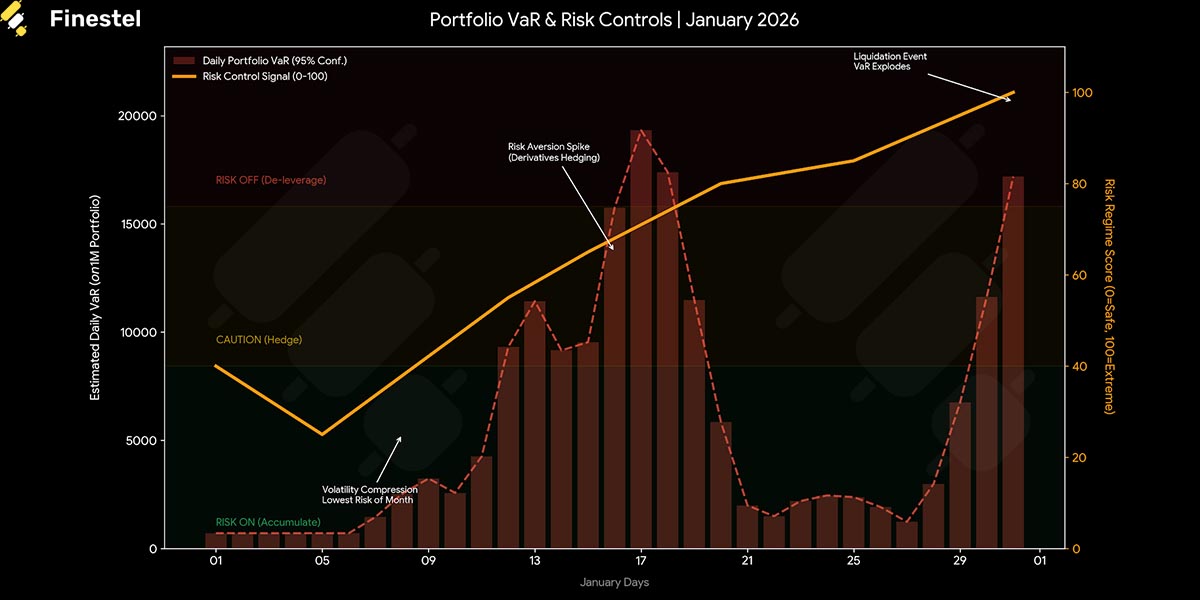
- Phase 1: The “Safe” Zone (Jan 1-10):
- Metric: VaR was minimal, and the Risk Score dropped to ~25/100.
- Action: This was the “Rational Recovery” phase where volatility compression signaled a safe environment for leverage (Risk On).
- Phase 2: The Warning Signs (Jan 15-20):
- Metric: The Risk Signal spiked into the “Caution” zone (40-70) before the price fully collapsed.
- Indicator: This aligns with the report’s mention of “increasing demand for downside protection” in the options market during Week 3. Smart money was hedging while prices were still high.
- Phase 3: The Danger Zone (Jan 25-31):
- Metric: VaR exploded, and the Risk Score hit 100/100.
- Action: The “Risk Off” signal triggered firmly at the $87k breakdown. By Jan 31, daily VaR on a $1M portfolio spiked to over $40,000+ per day, signaling a total liquidation event.
Finestel Insider: The “Alpha” Divergence
While the broader market chased the $95,000 breakout, professional desks on Finestel were already executing a quiet exit. Our proprietary data reveals a distinct “Defensive Rotation” that began on January 15; a full two weeks before the crash.
The Strategic Liquidity Raise Managers didn’t just “hold”; they sold into strength.
- The Setup (Jan 1–14): As Bitcoin rallied, asset managers deployed aggressively, dropping stablecoin allocations to a 6-month low of 5.2% to capture the upside.
- The Pivot (Jan 15–24): This is where the alpha was generated. As ETF inflows peaked at $1.42 billion, managers treated this liquidity as an exit signal. They systematically distributed positions to late-arriving retail buyers, raising cash levels to 18.5% while prices were still near highs.
- The Result: By the time the macro flush accelerated on Jan 31, stablecoin reserves had swelled to 28.4%. This wasn’t luck; it was a disciplined execution of “selling the rip.”

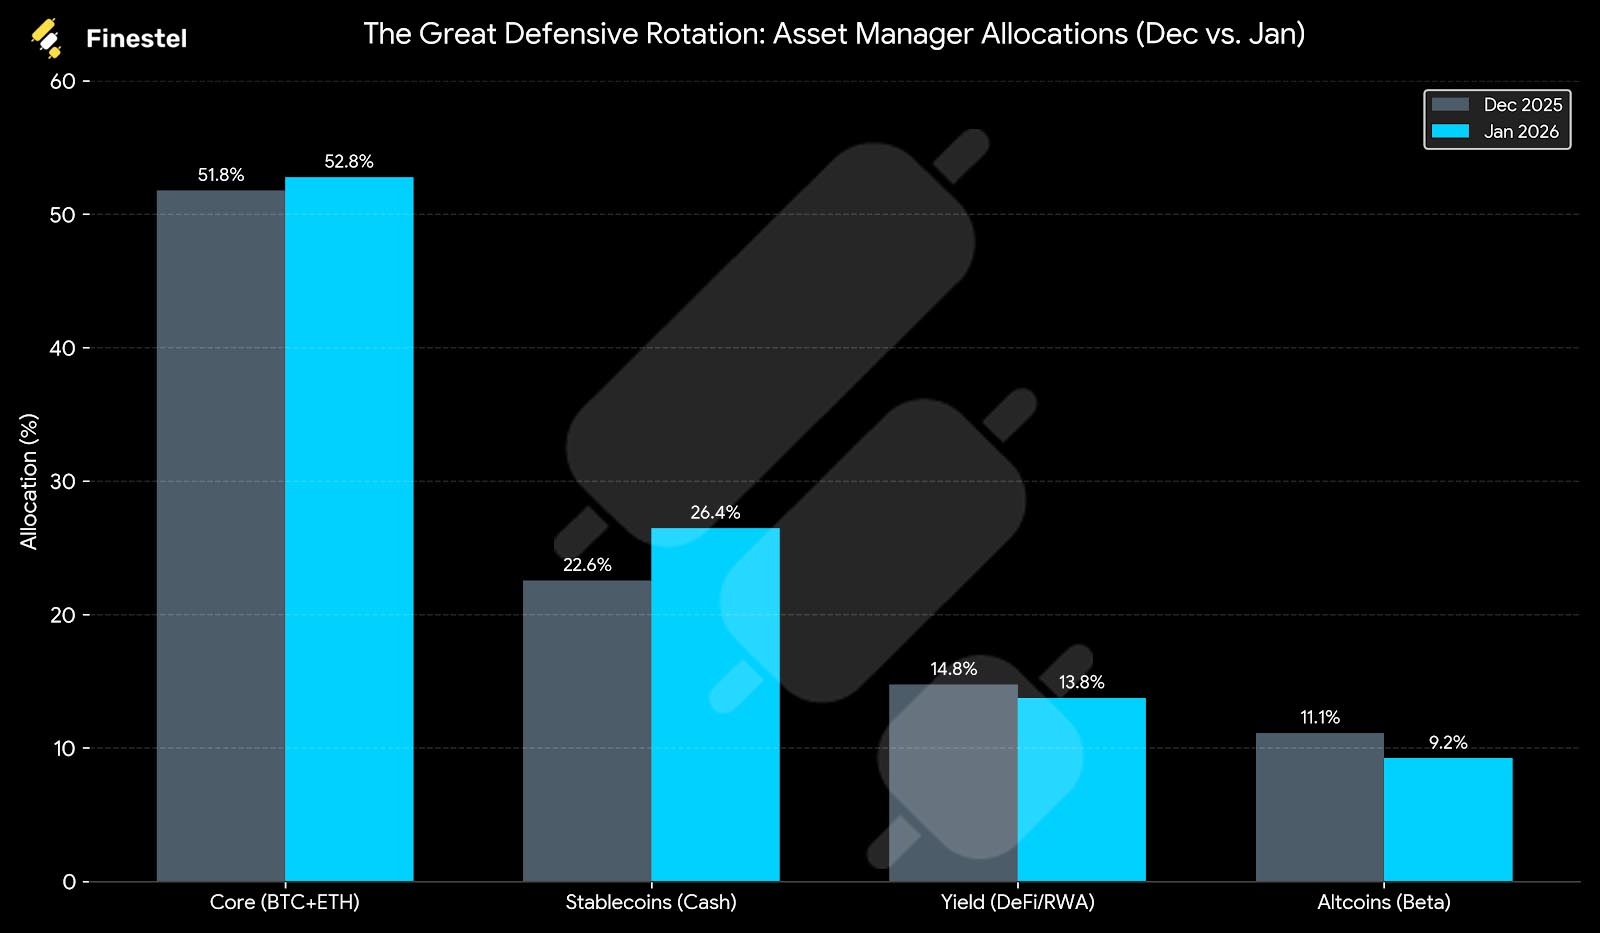
December 2025 vs. January 2026: The Great Defensive Rotation
This table highlights the single most important trend of the month: The aggressive raising of liquidity. While December was about “De-leveraging,” January was about “Capital Preservation.” Managers utilized the mid-month ETF liquidity to sell risk assets and nearly doubled their stablecoin war chests compared to early Q4 2025 levels.
|
Allocation Category |
Dec 2025 (Average) |
Jan 2026 (Average) |
Net Change |
Key Strategic Drivers |
|
BTC + ETH (Core) |
51.5% – 52.0% |
52.5% – 53.0% |
▲ +1.0% |
Flight to Liquidity: Despite the crash, managers increased relative exposure to BTC as the “only safe house in a bad neighborhood.” Aggressive buy-limit orders triggered at the $84k support. |
|
Stablecoins (Cash) |
22.0% – 23.1% |
24.5% – 28.4% |
▲ +5.3% |
The Alpha Move: Managers sold the $98k ETF rip. Cash reserves hit a cycle high to hedge against the U.S. Govt shutdown and allow for bottom-fishing at $77k. |
|
DeFi / RWA / Yield |
14.5% – 15.0% |
13.5% – 14.0% |
▼ -1.0% |
Yield Flight: Rotation out of speculative DeFi protocols and into “Hard RWA” (Treasurys) and Liquid Staking (EigenLayer) to maintain yield during flat price action. |
|
Altcoins (Beta) |
10.8% – 11.4% |
9.0% – 9.5% |
▼ -1.9% |
The Cull: Complete exit from high-beta assets. Exposure concentrated strictly in SOL (Firedancer catalyst) and Infrastructure. Memes were cut to zero. |
|
Leverage Ratio |
1.3x – 1.5x |
1.1x – 1.2x |
▼ De-Risk |
Leverage Reset: With funding rates flipping negative, pros removed leverage entirely, opting for spot positions + options hedges instead of perp futures. |
|
Portfolio VaR |
~7.5% |
~7.0% |
▼ Tighten |
Beta Dampening: By raising stablecoins to ~28%, managers mathematically forced their Daily Value-at-Risk down, decoupling from the market’s 45% volatility spike. |
February Outlook: The Defensive Rebuild
The “tourists” have been flushed out, and the leverage has been reset. February presents a landscape where the market is bruised but mathematically attractive for allocators. With Futures Open Interest (OI) down 25% and funding rates flipping negative, the speculative froth that capped upside in January is gone.
The Strategy: Accumulation, Not Aggression. The Finestel consensus for February is “Defensive Accumulation.” The smart money isn’t chasing candles; they are bidding structural support. The playbook is simple:
- Defend the Floor: The $75,000–$77,000 zone is the new institutional line.
- Wait for Confirmation: A weekly close back above $84,000 is the required signal to redeploy heavy capital into altcoins. Until then, Bitcoin dominance is the only safe trade.
The Verdict: January transferred wealth from weak ETF hands to strong corporate balance sheets. Expect a “grinding” recovery in the first half of the month as the market digests the overhang, followed by a potential resumption of the uptrend once the macro dust settles. Stay liquid, stay patient, and let the price come to you.


Leave a Reply