
Nobody expected the March crypto market report to look like this. After February’s wipeout, six straight red weeks, $60k lows, $3.8B in ETF outflows, the base case was more pain. Consolidation at best. Instead, Bitcoin put in its strongest weekly gain since May 2025, broke out of the $63k–$70k range that had trapped it for weeks, and briefly touched $71,000 before the geopolitical situation got messy again.
The month ended near $68,233. Up roughly 2% on the month. Against a backdrop of oil briefly hitting $100, a hawkish Fed, sticky inflation, and active military conflict in the Middle East, that’s not a bad result. Traditional risk assets were under far heavier pressure. Crypto held.
It wasn’t clean. Nothing about March was clean. But the structure that emerged by month-end looks meaningfully different from where February left off, and that matters for what comes next.
This is Finestel’s official monthly crypto market report for March. It analyses exactly how the market performed under intense geopolitical tension, and how our tracked asset managers responded throughout the month.
March Crypto Market Report in Numbers: Performance and Institutional Flow
March came in four very distinct phases, and lumping them together misses the story.
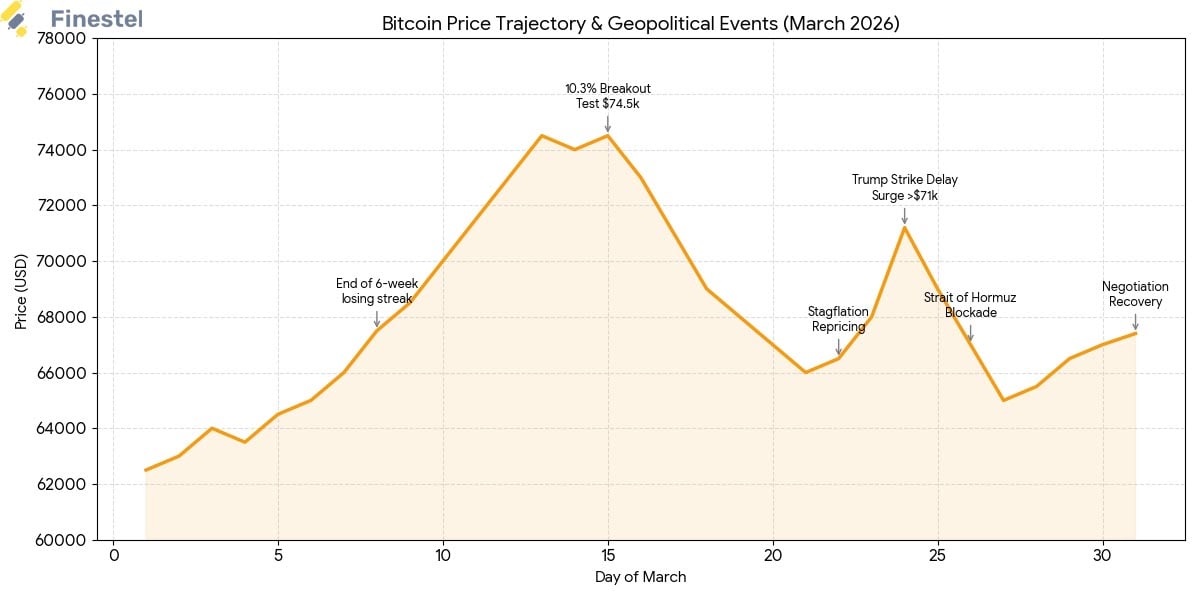
The first week was quiet. BTC eked out a +0.32% gain, ended the six-week losing streak, and US ETF flows turned positive, $568M net inflow. Not exciting. But after February, “not exciting” felt like a relief.
Then week two happened. Bitcoin ran +10.36%, the largest weekly gain since May 2025. ETF inflows hit $767M. The $63k–$70k consolidation range that had been the ceiling for weeks became the floor. Something had shifted in the order flow. Regional divergence was stark; Asian exchanges carried the weight of buying while Coinbase Premium stayed negative for 11 straight days, signaling US capital still sitting out.
Week three gave most of it back. Down 6.8% as stagflation repricing hit in earnest. February PPI and core PCE both beat expectations. Goldman Sachs quietly raised its US recession probability estimate to 30%. ETF inflows held at $787M that week, institutions buying the dip, but the spot price couldn’t hold $72k. The supply vacuum between $72k and $82k, where almost nobody holds a cost basis, made rallies fragile.
Week four of March crypto market report: four straight days of losses, Bitcoin dropping below $65,000 to a monthly low. Iran blocked the Strait of Hormuz. Negotiations stalled again. The brief Trump-driven $71k spike on March 24, after he announced a five-day delay in potential strikes, got fully reversed when Iran denied the terms within hours.
The recovery at month-end came on March 30–31 when Trump signaled indirect talks were “progressing smoothly.” Modest bounce. Cautious optimism. Nobody was pressing longs into an unresolved geopolitical situation with an April 6 deadline hanging over energy facilities.
Summary numbers: Total crypto market cap closed at $2.29 trillion, down 3.1% month-on-month. Trading volume dropped to $608 billion, off 11.9% from February. Lower volume on falling prices is a defensive signal, not a capitulation one. The market wasn’t panicking. It was waiting.
Geopolitics Ran the Show
There’s no way to write an honest March report without leading with geopolitics, because geopolitics was the market. Bitcoin and US stocks moved in near-lockstep all month; correlation didn’t drift, it locked in. Every headline from the Middle East moved crypto within minutes.

US–Israel strikes. Iranian retaliation. Mines in the Strait of Hormuz. Repeated negotiation breakdowns followed by carefully worded optimism, followed by reversals. March 24th was the clearest example of how binary this market became: Trump’s five-day delay announcement sent BTC up sharply intraday. Iran denied the framing of that announcement within hours. Price gave back the move almost entirely.
By month-end, the official read was that the conflict would last another two to four weeks, with April 6 as the next hard date for potential action on Iranian energy facilities. That’s the backdrop heading into April. Oil near $100 isn’t a crypto problem specifically; it’s an everything problem. Energy shocks feed inflation, delay rate cuts, and compress risk appetite across every asset class.
The macro data wasn’t helping either. February PPI beat. Core PCE beat. The March FOMC held at 3.5–3.75%, with Powell’s tone reading hawkish enough that rate-cut expectations got pushed deep into late 2026. Some desks started pricing in the possibility of hikes, which would have seemed absurd three months ago.
Stagflation conditions. Bitcoin correlated with equities. Not ideal.
What the Chain Actually Showed
On-chain data told a more constructive story than price action suggested, which is usually a useful divergence to pay attention to.

Global spot CVD (Cumulative Volume Delta) stayed positive for most of the month, meaning buying pressure was consistently showing up below $70,000 even when headlines were ugly. The regional split was notable: Asian exchanges carried the buy-side weight while Coinbase Premium stayed negative for 11 straight days. US capital wasn’t leading. It was watching.
Short-term holders took profits in the $63k–$69k range during the mid-month rally; that’s normal and healthy, not a red flag. What’s more important is what happened to the coin supply. Over 210,000 BTC were added to holdings in the $66k–$68k zone across the month. That’s a meaningful reinforcement of short-term support. That range has now been tested from below multiple times. It’s hardening.
The problem, and it’s been the same problem since October 2025, is the supply vacuum between $72k and $82k. Almost no one holds a cost basis in that zone. So every rally into it runs into minimal buying and eventual distribution from holders above. $74,500 got tested three times in March. Three times it held as resistance. Until that level flips to support, the upside is capped.
Miners recovered through most of the month. Hash rate stabilized. The capitulation signal from February gradually faded as production costs were no longer underwater on a sustained basis. That removes one source of potential forced selling from the near-term picture.
ETFs: Inflows, Then a Pause
February’s outflow streak ended hard in March. US spot Bitcoin ETFs posted strong net inflows for the first three weeks, with buying concentrated in the $63k–$64k range that institutions had already established as their psychological anchor coming out of February. Two consecutive weeks of $500M+ inflows confirmed that the February unwind was tactical, not structural.
Then week four reversed it. Net outflow of $290M, the first negative ETF week in nearly a month. That coincided with the Strait of Hormuz blockade and the four-day losing streak in BTC price. Hard to separate cause and effect, either ETF sellers drove price down, or price falling triggered the redemptions. Probably both, at the margin.
The strategy also paused. Their 13-week consecutive Bitcoin buying streak ended in March. That’s worth noting, not because one week matters, but because Strategy suspending its buying removes a consistent marginal buyer from the market at exactly the point when sentiment is fragile. Not a disaster. But not nothing either.
March Crypto Market Report: The Stagflation Problem
The word “stagflation” started showing up in serious research notes in March. It’s not a dramatic word choice; it’s accurate.
Energy prices up. Tariffs are still in place. February PPI beat. Core PCE beat. The Fed is holding rates and signaling no urgency to cut. Goldman’s recession probability is at 30%. That’s the cocktail. Growth is slowing, prices are sticky, and the central bank doesn’t have clean cover to ease.
For Bitcoin, the correlation problem is real but nuanced. BTC trades like a risk asset in risk-off environments, which is what macro-driven selloffs look like. But it also trades as a store of value and inflation hedge in environments where monetary policy is losing credibility, which is the other thing stagflation implies. March was mostly the former. The question for April and beyond is whether the latter narrative gets any traction.
Treasury mechanics are worth keeping in mind for timing. The TGA refill dynamics that tighten liquidity through April start to ease in May. If the conflict stabilizes and macro data softens even slightly, the May window remains the first real opening for risk assets to breathe.
How Finestel Managers Traded It
Same playbook as February, disciplined, opportunistic on dips, not chasing strength.
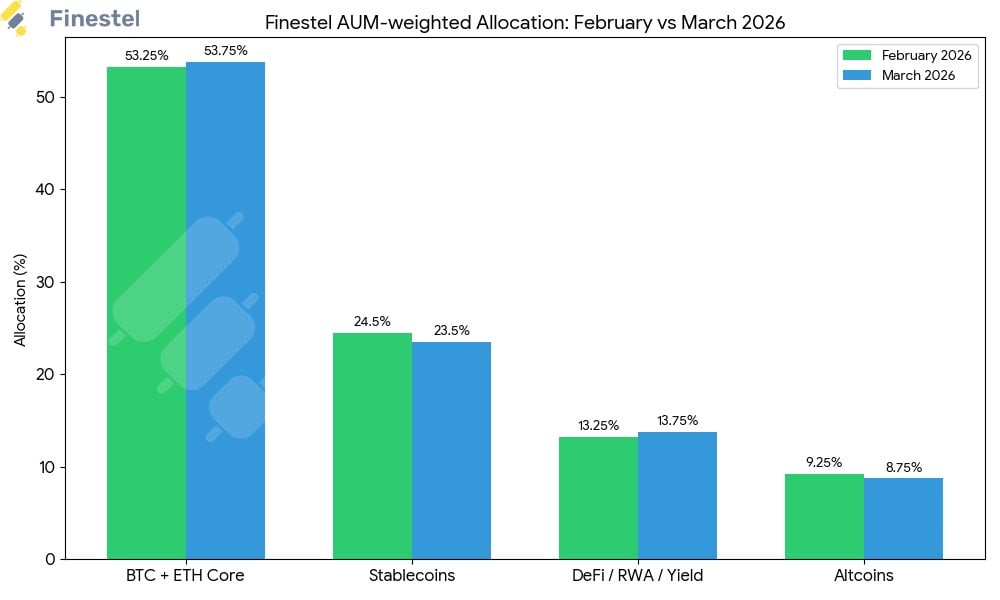
BTC/ETH core nudged up slightly to 53.5–54%, with selective accumulation during the mid-month weakness. Stablecoin allocation dropped a point, from 24–25% to 23–24%, as some of that dry powder got deployed into the mid-month rally. Not a big move, but a directional one.
DeFi and RWA exposure actually went up, to 13.5–14%. In an environment where BTC might grind sideways and macro conditions stay uncertain, yield-bearing positions that don’t require a bull market to perform make sense. EigenLayer and Pendle are the specific names.
Altcoin exposure trimmed further, down to 8.5–9%. High-beta names got cut. What remained was concentrated in AI infrastructure and select privacy plays, the same theme from February, just tighter.
|
Allocation |
Feb 2026 |
Mar 2026 |
Change |
Driver |
|
BTC + ETH Core |
53–53.5% |
53.5–54% |
+0.5% |
Selective accumulation on dips |
|
Stablecoins |
24–25% |
23–24% |
–1% |
Deployed into mid-month strength |
|
DeFi / RWA / Yield |
13–13.5% |
13.5–14% |
+0.5% |
Yield in uncertain macro |
|
Altcoins |
9–9.5% |
8.5–9% |
–0.5% |
High-beta trimmed |
|
Leverage |
1.1–1.2x |
1.0–1.2x |
Stable |
Risk management priority |
|
Portfolio VaR |
~6% |
~5.5% |
Tighter |
Options hedging around events |
Derivatives: Fear, Then Neutral
Options markets opened March pricing in significant downside risk, heavy put demand, negative gamma concentrated around $75k, $70k, and $60k strikes. During the mid-month rally, that fear eased. Implied volatility compressed. Call buyers showed up.
By month-end, funding rates across major CEXs and DEXs had returned to roughly neutral. No more negative funding that had characterized late February. That’s a healthier starting point for April than what existed going into March. The speculative leverage that was built through Q4 2025 and got wiped out in February hasn’t come back, which is probably the most important structural shift of the past six weeks.
Trending tokens in the final week: MemeCore +28%, Shuffle +23.6%, Bittensor TAO +22.3%, Chiliz CHZ +17.2%, FET +13.4%. Rotation into speculative names in week four suggests at least some risk appetite returning at the margins, but these moves were concentrated in specific narratives, not broad-based altcoin strength.
What April Needs to Deliver
The market has done something real in March. The February leverage flush is complete. Short-term capitulation has largely played out. 210,000+ BTC added around $66k–$68k means that support zone has real structural backing now, not just hope.
But the ceiling is also real. $74,500 has been tested three times and rejected three times. The supply vacuum above it makes every rally technically fragile until that level flips. A decisive close above $74,500 opens the path to $83k — and then the picture changes meaningfully.
Polymarket has the probability of the Middle East conflict resolving by end of April at around 30%. April 6 is the next hard deadline on Iranian energy facilities. If that passes without escalation and indirect talks hold, sentiment could shift faster than the macro numbers would suggest.
Finestel’s positioning heading into April:
- 53.5–54% BTC/ETH core: defend the $63k–$66k anchor; it’s earned its status
- 23–24% stablecoins: don’t deploy it all at once
- 13.5–14% yield-bearing DeFi/RWA: consistent returns that don’t need a bull market
- 8.5–9% high-conviction alts: AI infrastructure, select privacy, Layer-1/2 catalyst plays
Options hedges around major macro prints and geopolitical events. April 6, FOMC communications, CPI, all of it.
March showed that this market can absorb serious shocks without breaking. February’s $60k lows weren’t revisited. Institutional buyers stepped in at $63k–$64k and held. The structure is more balanced than it was a month ago. Whether March was the start of a new leg higher or just a tactical rebound inside a still-cautious macro regime, that’s April’s question to answer.


Leave a Reply