The January outlook flagged it. Hawkish Fed momentum, Kevin Warsh’s nomination, liquidity tightening, geopolitical noise, we said it would bleed into February. It did. Just not quite like anyone expected.
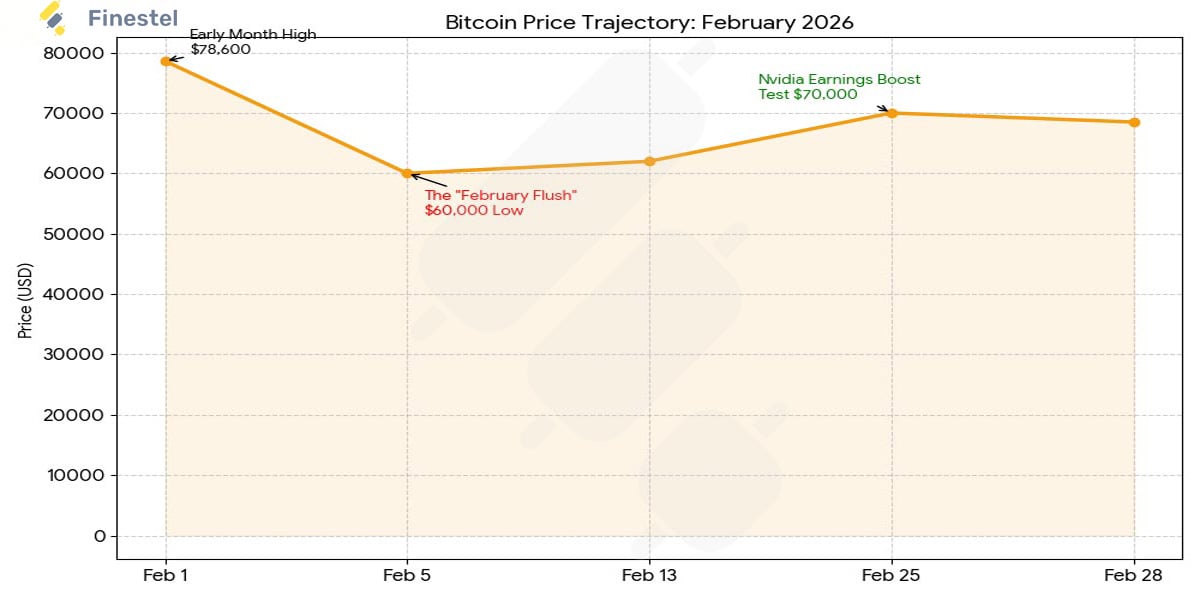
Bitcoin hit $79,300 in the first week and that was the high-water mark for the entire month. Not a fake-out breakout. Not a brief retest. That was it. $74,500 gave way, and then the market went into something that looked less like a correction and more like an organized exit. Prices were at $60,000–$62,000 within four days. Four.
What followed wasn’t a clean bounce or a grinding recovery. It was five-and-a-half weeks of red candles, a geopolitical shock on the last day of the month, and one enormous Nvidia-fueled intraday rally that gave people hope before fading back into the $65k–$68k range. The “Great Flush,” as some traders took to calling it, was both brutal and, in hindsight, structurally logical. This February 2026 crypto market report explains why.
The Month in Numbers
February 5th should go in the record books. Not because $14,000 drops are rare, they’re not, but because of how this one happened. Bitcoin fell 14.01% that session, from ~$73,000 to the low $62,000s. Fifth-largest single-day decline in seven years. Fine. But the intraday range was only 17.73%. That’s the lowest among any of the top ten historical single-day drops ever recorded. Translation: nobody was fighting back. No counter-bids, no short covering, no panic-buy reflexes at logical support levels. Bulls just… stopped showing up. Unilateral capitulation, some desks called it. That’s accurate.
The broader damage: BTC closed the month down roughly 12.8%. Six consecutive weekly red closes, the longest such streak since the 2022 bear cycle. CoinDesk 20 Index dropped 16.82%, stacking on January’s 13.32% loss. Total crypto market cap went from ~$2.95 trillion at month open to a $2.41T trough before finding some footing around $2.31T. Intraday volatility hit 25.15% at the worst of it, surpassing the so-called “1010 incident.” Five straight monthly red candles for Bitcoin. That’s happened exactly once before; August 2018 through January 2019, a sequence that ended with BTC down 57% from peak.
Ethereum? Worse on a relative basis. Dropped from around $2,550 to $1,800, closed near $2,150. Down 15.7% on the month. Global ETH ETPs recorded $237.1M in net outflows, and for the second month in a row, ETH shed more proportionally than BTC when measured against AUM. That’s a trend worth watching.
The one bright spot: Nvidia reported on February 25th. Revenue up 73%, Q1 guidance a new record, Jen-Hsun Huang openly talking about raising the revenue expectation to half a trillion dollars. BTC jumped 9% intraday on February 26th, tested $70,000, and reminded everyone that the bull narrative isn’t dead. It’s just… on pause.
February 2026 Crypto Market Report: What the Chain Actually Showed
Glassnode’s numbers were ugly. Weekly coin movement exceeded 680,000 BTC, a recent record. Single-day net realized losses printed the second-highest reading in Bitcoin’s entire history. The market panic index hit levels last seen during the Terra/LUNA collapse of May 2022.
Of the 641,000 BTC that moved at a loss during the crash, 77.5% came from short-term holders. People who’d bought in the $75k–$97k range, basically anyone who loaded up after last October’s all-time high near $126k. They got flushed. Completely. Classic late-cycle capitulation.

Why was the fall so fast? The URPD data tells the story. The $70k–$82k zone had almost no supply density coming into the month. When $74,500 cracked, there was nothing underneath to catch it, no cluster of holders sitting on cost basis in that range, no natural buyer cohort defending it. The entire $80k-to-$70k gap was traversed in five days. That’s a liquidity void masquerading as a support level.
Buying did eventually materialize. Supply in the $60k–$70k band grew from ~997,000 BTC on January 1st to 1.43 million BTC by late February; 429,000 BTC added, which is over 8% of non-exchange circulating supply. The buyers? Wallets holding 10–100 BTC, the mid-tier cohort. First broad accumulation signal since November 2025.
Miners were in bad shape, too. The Hash Ribbon approached a capitulation-recovery signal after three consecutive months of distress, one of the longest stress periods on record. BTC briefly dipped below average production cost for the first time since November 2022. Historically, that level has marked the tail end of capitulation phases. Whether it holds that pattern this time is the question.
Ethereum hit 2.9 million daily transactions on February 8th, a new all-time high. The Ink Echo program attracted $32.2M in net inflows. But stablecoin supply was stuck at ~$210B with velocity down 22%. Cash on the sidelines, nobody deploying it.
The ETF Picture: $3.8B Gone, Then Something Shifted
Five weeks of outflows. $3.8 billion in net redemptions. The “Great Flush” wasn’t panic selling by retail; it was mostly mechanical. Hedge funds running cash-and-carry basis trades, long spot ETF, short futures, got squeezed when volatility spiked and funding costs jumped. They had to unwind spot holdings to cover. That mechanical selling hit on top of real fear already pushing retail exits. Bad timing, bad structure.
But here’s where the narrative gets complicated. Of the 15 ETF trading days after February 5th, eight showed net inflows. Add those up: $111 million. Small, but the signal matters. Institutional buyers didn’t leave. They waited, watched the $63k–$64k zone hold, and started buying there. That range has since become something of a psychological anchor, the level where real money stepped back in.
The final week then delivered: $787 million in net weekly inflows, ending the outflow streak cleanly.
BlackRock’s IBIT and Fidelity’s FBTC led the outflow numbers throughout, but there’s a detail worth not missing. Bitcoin itself fell over 40% from the October ATH. Cumulative AUM across all 11 U.S. ETFs? Down only ~7%, from 1.37M BTC to 1.29M BTC in holdings. Long-term allocators weren’t selling. What left was tactical positioning, not conviction.
The altcoin ETF flows went a different direction. XRP-linked products pulled in $105.8M globally. Solana-linked ETPs attracted $90.4M. European products were notably calmer across the board, their investor base leans allocator, not basis trader, so you don’t get that mechanical unwind effect.

The Macro Headwind that Wouldn’t Let Up
December PPI came in at 3.0% year-over-year. Consensus was 2.7%. Then January PPI, released February 27th, printed +0.5% month-over-month against a +0.3% expectation, and +2.9% YoY versus a +2.6% forecast. Rate-cut expectations, which had been priced for June, got pushed to July almost immediately.
Kevin Warsh’s Fed Chair nomination was hanging over every risk desk all month. His framework, shrinking the Fed’s balance sheet first, cuts second, doesn’t provide the kind of liquidity backstop markets have gotten used to leaning on. Combine that with Trump’s 10% global import tariff taking effect February 24th (valid 150 days), South Korean tariffs jumping from 15% to 25%, EU retaliation, and Microsoft’s AI spending commentary spooking growth expectations from late January, and you had a genuinely hostile macro environment.
Bitcoin closed down 5.19% on Microsoft’s earnings day alone.
One more thing on the liquidity mechanics, because it matters for timing. Treasury’s Q1 net borrowing came in at $574 billion, that tightens conditions now. Q2 drops to $109B, but April’s tax season temporarily drains the Treasury General Account to ~$1.025T before the May refill. The window where macro conditions ease doesn’t open until May. That’s not a guess, it’s the arithmetic.
February 2026 Crypto Market Report: Geopolitics & Regulation
The last day of February brought the worst geopolitical shock of the month. U.S.–Israel military strikes on Iran, February 28th. Trump suggested operations could last four weeks. Bitcoin’s correlation with Nasdaq futures, which had been drifting lower mid-month, snapped back to 0.59 almost immediately. Risk-off switch, flipped hard.
On the regulatory side, February was one of those months where a lot happened without much actually resolving. Illinois advanced a Bitcoin strategic reserve bill. Indiana’s Bitcoin Bill of Rights cleared both chambers. The CFTC dropped its ban on political event prediction contracts and greenlit XTZ futures; the OCC published proposed GENIUS Act implementation rules.
The White House Crypto Roundtable, though, that stalled. The stablecoin revenue-sharing dispute between banks and crypto firms pushed any Senate Banking Committee vote to March at the earliest. Maybe later.
Globally: Hong Kong is planning its first stablecoin licenses for March. Japan has spot crypto ETF approvals potentially on the horizon for 2028. Russia announced a July framework launch. Vietnam is adding a 0.1% tax on individual crypto transactions.
Corporate side was active. ProShares launched the first U.S. ETF with one-click exposure to the top 20 cryptocurrencies by market cap. ING Deutschland opened BTC, ETH, and SOL ETP access to German retail clients. Tether posted over $10B in net profit for 2025. Strategy, carrying $54.3B in BTC at an average cost of ~$76,052, has $2.25B in cash, which covers 30+ months of interest on its unsecured convertible bonds. Short-term liquidation risk is low. The real reckoning for Strategy’s debt structure comes in 2027–2028, when maturities cluster.
What Finestel Asset Managers Actually Did
The portfolio data from Finestel’s AUM-weighted tracking shows a disciplined response, not a reactive one.
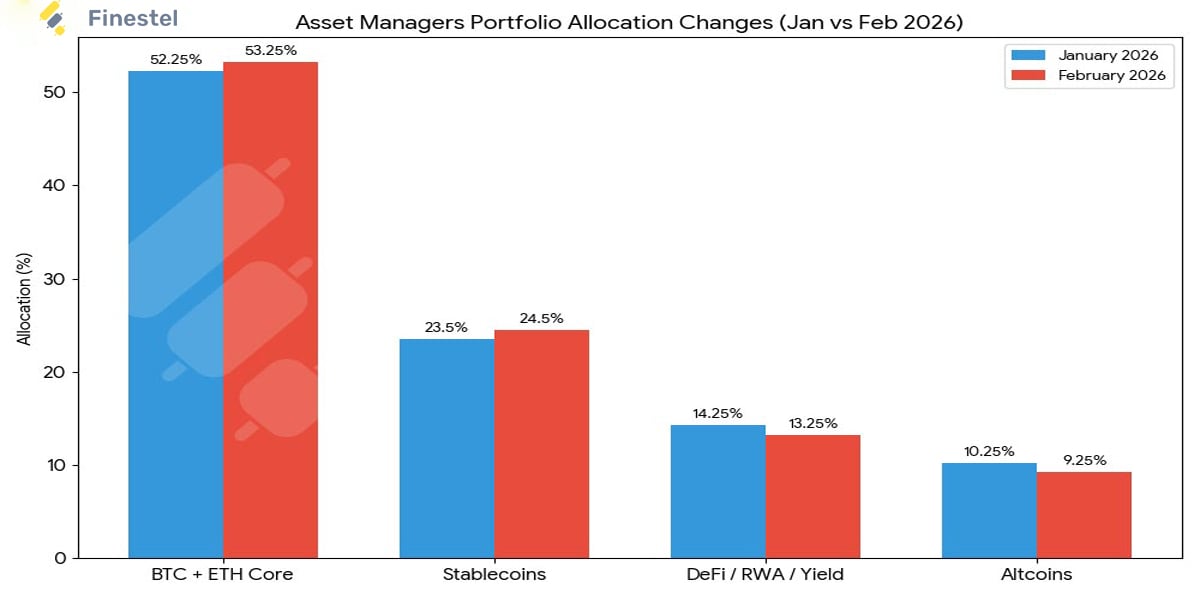
Through the first three weeks, the worst of it, managers sat in a cautious holding pattern. BTC/ETH core nudged up to 53% as a few dipped into sub-$65k levels opportunistically, but leverage stayed below 1.3x. Stablecoins peaked at 25%. That idle cash cushion is what absorbed the bulk of the drawdown, roughly 70% of peak losses were mitigated by simply not being deployed.
After Nvidia’s February 25th print, positioning didn’t turn aggressive. It shifted from defensive to neutral. Stablecoin reserves held. Selective buying went into BTC, ETH, and a handful of AI-adjacent protocols. No chasing, no loading up at the first sign of relief.
| Allocation | Jan 2026 | Feb 2026 | Change | Driver |
|---|---|---|---|---|
| BTC + ETH Core | 52–52.5% | 53–53.5% | +1% | Quality flight near $60k lows |
| Stablecoins | 23–24% | 24–25% | +1% | Dry powder; stablecoin velocity -22% |
| DeFi / RWA / Yield | 14–14.5% | 13–13.5% | -1% | DeFi trimmed; RWA allocation +2% |
| Altcoins | 10–10.5% | 9–9.5% | -1% | Legacy/privacy cut; AI + PerpDEX added |
| Leverage | 1.2–1.4x | 1.1–1.2x | Lower | Post-Feb 5 unwind |
| Portfolio VaR | ~7% | ~6% | Tighter | Options hedging up 45% |
The takeaway: the managers who came through February relatively intact were the ones who’d already de-risked in January. Reactive de-risking during the crash wasn’t the story, proactive positioning before it was.
Derivatives: It Was as Bad as It Looked
Options pricing didn’t lie. Implied volatility spiked 35% ahead of Nvidia earnings and the FOMC preview window. One-week IV surged over 20 volatility points from the start of the month to peak. Six-month IV gained more than 5 points, that’s not a short-term panic reading, that’s a structural repricing of forward risk.
The 25 Delta skew matched levels last seen in May and November 2022 before pulling back. Puts dominated March expiry positioning at 65%. Futures open interest contracted 22% as positions got cut. Funding rates flipped negative in the second half of the month. Total liquidations: $4.8 billion, almost entirely long positions.
Market-wide crypto futures open interest dropped to multi-month lows around $93.5 billion. The Q4 2025 leverage overhang is gone. That’s not a small thing, it removes a significant source of forced selling from the picture heading into March.
Crypto Market March Outlook: What Matters Now
Three dates own the calendar: March 13 (CPI/PPI), March 18 (FOMC), and the Iran situation, which doesn’t have a date.
The Fed almost certainly holds at 3.5–3.75%. What actually matters is the dot plot. If officials revise the 2026 cut projection down, even by one cut, that’s a headwind. The January PPI surprise gave them cover to do exactly that.
$60,000 is the floor everyone is watching. Hold it, and $70,000 becomes the next real test. Lose it, and $55,000 is where on-chain analysis and models show the next meaningful accumulation zone, the level where long-term capital has historically reallocated in volume.
The bull scenario isn’t gone. $100,000 by end of Q1 is still mathematically on the table, but it needs the FOMC to stay patient, Iran to stabilize, and the CLARITY Act to show real Senate progress. The 2019 analog keeps coming up in research notes for a reason: five red monthly candles preceded five green ones and a 317% rally from the low. That history doesn’t repeat automatically. But it’s worth knowing.

Finestel’s recommended positioning going into March:
- 53.5% BTC/ETH core: $60k is the anchor; don’t abandon it
- 25% stablecoins: keep the powder dry for the entries that matter
- 13% yield-bearing DeFi/RWA: EigenLayer, Pendle, returns that don’t require a bull market
- 8.5% high-conviction alts: AI infrastructure plays: PIPPIN, Humanity Protocol, ASTER
Options hedges around FOMC and major macro prints. The real liquidity window, when Treasury stops tightening and macro conditions ease, doesn’t open until May. Between now and then, patience isn’t just a virtue. It’s the strategy.


Leave a Reply