
If you only glanced at a Bitcoin price chart in the June crypto market reports, you’d have missed the story entirely. The candles look calm. Boring, even, a tight range between $58,000 and $66,000, the kind of chop that tempts traders to close the laptop and wait for something to happen.
But nothing about June 2026 was calm underneath the surface. This was the month the crypto market’s internal plumbing started leaking, even as the price held its shape. Institutions sold into every rally. Spot demand from the US went quiet for the better part of six weeks. Derivatives desks stopped putting on fresh leverage. And on-chain, the cost basis of Bitcoin’s holder base kept sliding lower, week after week, like a tide going out just slowly enough that nobody notices until the boats are sitting in mud.
That’s the real June 2026 crypto market report: not a crash, not a rally, but a controlled unwind; liquidity draining out faster than it’s coming back in.
This June 2026 crypto market report synthesizes data from Finestel and KuCoin internal data and, on-chain forensics from Glassnode and Chainalysis.
The Macro Backdrop: Two Pressures, One Direction
Two forces dominated the macro conversation this month, and both pushed the same way.

The first was geopolitical. Tensions between the US and Iran refused to settle into either war or peace, instead oscillating between fragile ceasefire talk and renewed military exchanges. Each time diplomacy showed signs of progress, markets exhaled. Each time it collapsed, they tensed back up. Shipping congestion near the Strait of Hormuz became a genuine flashpoint, with reports of more than 400 vessels backed up in or near the region at various points in the month; a visible symptom of how seriously traders were pricing supply disruption risk.
What made this pattern damaging wasn’t any single shock. It was the repetition. Every relief rally in risk assets, crypto included, ran out of steam within days because the next headline was never far behind. That kind of environment doesn’t produce crashes; it produces hesitation. Capital that would otherwise commit for weeks or months instead sits on the sidelines, unwilling to underwrite duration risk in a market that could reverse on a single news cycle.
The second pressure came from the Federal Reserve, and it was arguably more consequential for crypto specifically. Inflation simply refused to cooperate. Headline CPI held at 4.2% year-over-year, core CPI printed at 2.9%, and core PCE, the Fed’s preferred gauge; hit 3.4%, its highest reading in several quarters. Normally, sticky inflation paired with a slowing economy might still open the door to rate cuts. But the labor market gave the Fed no such excuse: non-farm payrolls came in at 172,000, well above expectations, and GDP was revised up to 2.1%.
Put those two data points together and you get a Federal Reserve, under Chair Kevin Warsh, with zero incentive to ease. Policy stayed restrictive. Real yields stayed elevated. And crypto; which behaves less like digital gold and more like a long-duration, liquidity-hungry growth asset in environments like this; absorbed the pressure directly.

June 2026 Crypto Market Report: The Month in Numbers
| Asset Class | Early June Range | Mid-Month Extreme | Month-End Close | Monthly Change | Key Verdict |
|---|---|---|---|---|---|
| Bitcoin (BTC) | ~$73k–$67k | Low near $58k | ~$59,000–$60,000 | ▼ 5–8% (volatile) | Range-Bound Consolidation |
| Ethereum (ETH) | ~$2,500 | Low near $1,500–$1,600 | ~$1,570 | ▼ 12–15% | Pronounced Underperformance |
| Total Crypto Market Cap | ~$2.65T | ~$2.35T | ~$2.45T | ▼ ~8% | Defensive Sentiment Dominated |
| Bitcoin Dominance | Elevated | High | Sustained >61% | ▲ Maintained | Flight to Core Asset |
Bitcoin’s Price Action: Compression Without Conviction
Strip away the noise and Bitcoin’s June can be told in three attempts.
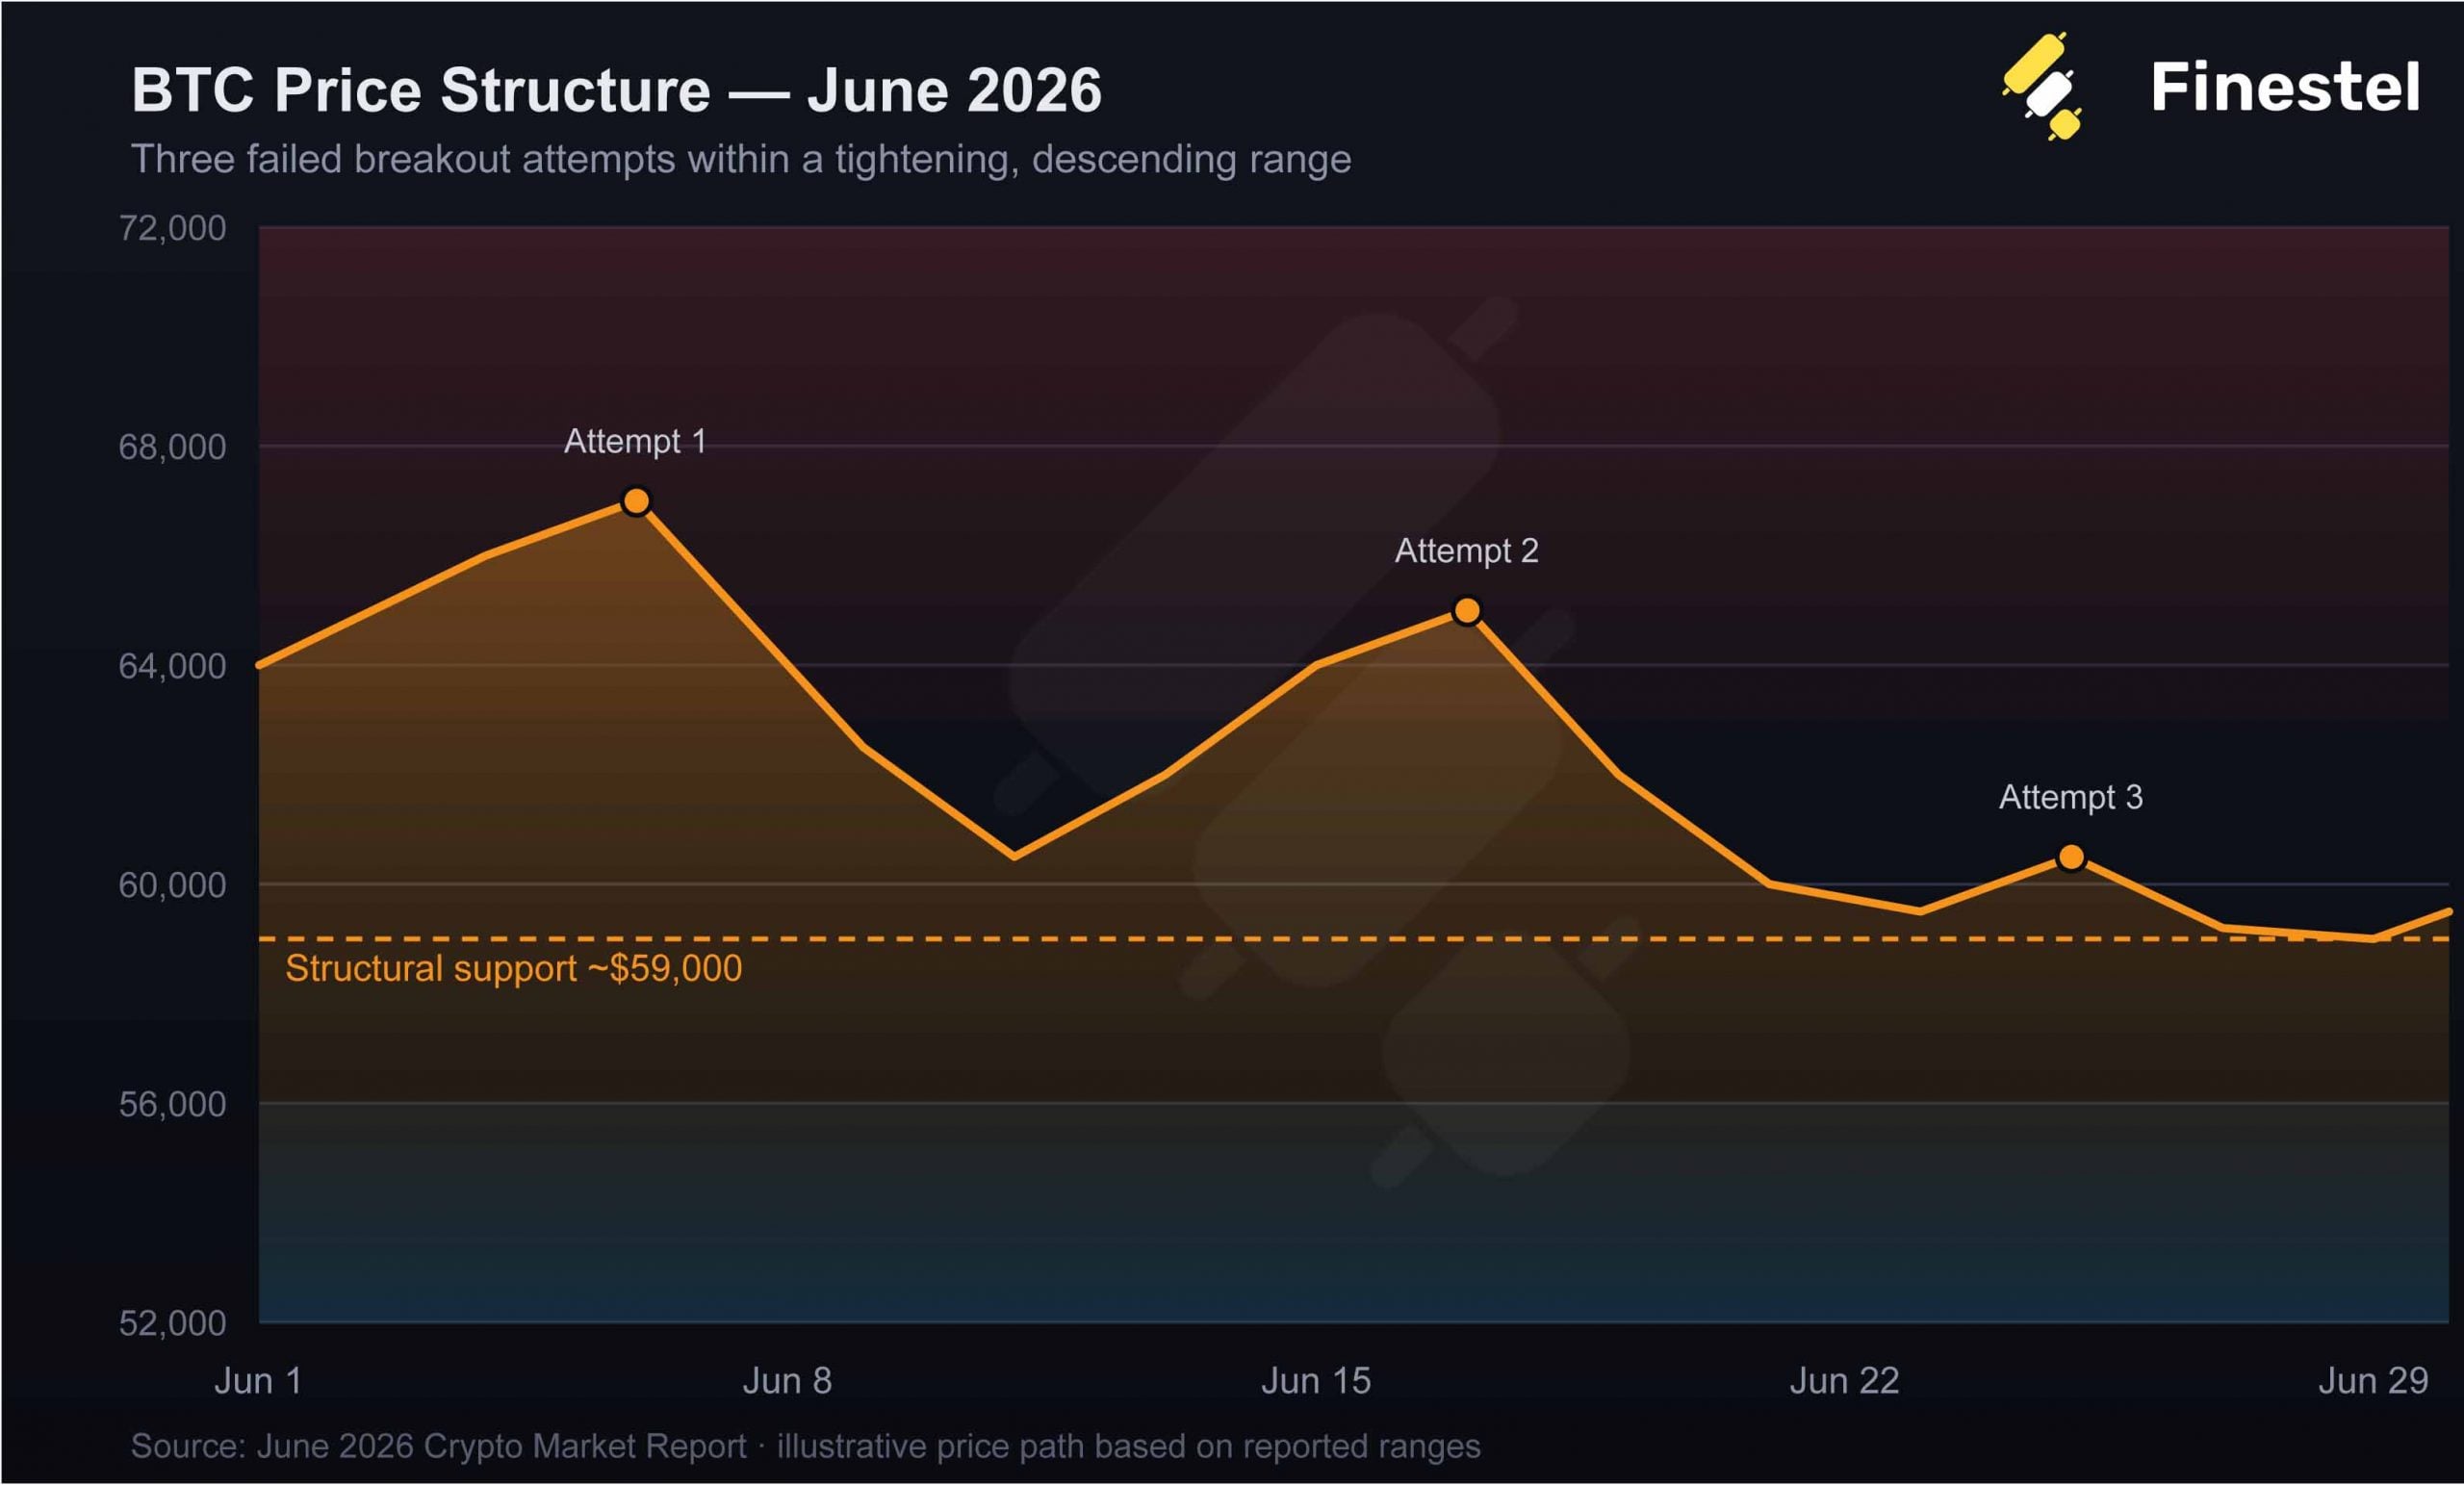
The month opened in the mid-$60,000s, with price pushing toward the $65,000–$67,000 zone early on. It got rejected. A relief rally mid-month carried price back to similar levels. Rejected again. By the close of June, Bitcoin had drifted back down to the $59,000–$60,000 area; the third retest of the same structural support level in a single month.
Three attempts, three failures, and a market that finished essentially where a technician would have flagged real danger.
Every major moving average, the 20, 50, 100, and 200-period EMAs, sat overhead as resistance throughout the month. Momentum indicators spent most of June below neutral. What emerged wasn’t a bottoming pattern or a basing structure; it was a descending consolidation, the kind of price behavior more associated with the middle of a corrective phase than its end.
This is the part of the June 2026 crypto market report that’s easy to misread if you’re only watching price. Consolidation usually implies accumulation happening quietly beneath the surface; smart money building positions while retail loses interest. June’s consolidation showed the opposite signature: compression without accumulation. The range held, but nobody was using it to build.
Where the Real Risk Sits: Mapping the Liquidity
Two levels now define Bitcoin’s structure, and they’re not symmetrical.
On the upside, resistance is dense between $63,000 and $72,000; exactly where prior distribution took place, meaning a lot of supply is parked there waiting to sell into strength. On the downside, $59,000 has become the line in the sand. But it’s what sits below that level that should command attention: the zone between $52,000 and $56,000 is a genuine liquidity vacuum, an area with historically thin trading activity and few resting buy orders.
That asymmetry matters. A breakout above $63,000 would require sustained inflows and a real change in market character; a slow, hard-earned move. A breakdown below $59,000, by contrast, could accelerate quickly, simply because there’s so little standing in the way. Thin books cut both ways, but in a market already leaking demand, the more likely direction for a liquidity vacuum to get tested is down.
ETF Flows: The Clearest Signal of the Month
If one dataset captures June better than any other, it’s ETF flows; and the picture they paint is unambiguous.
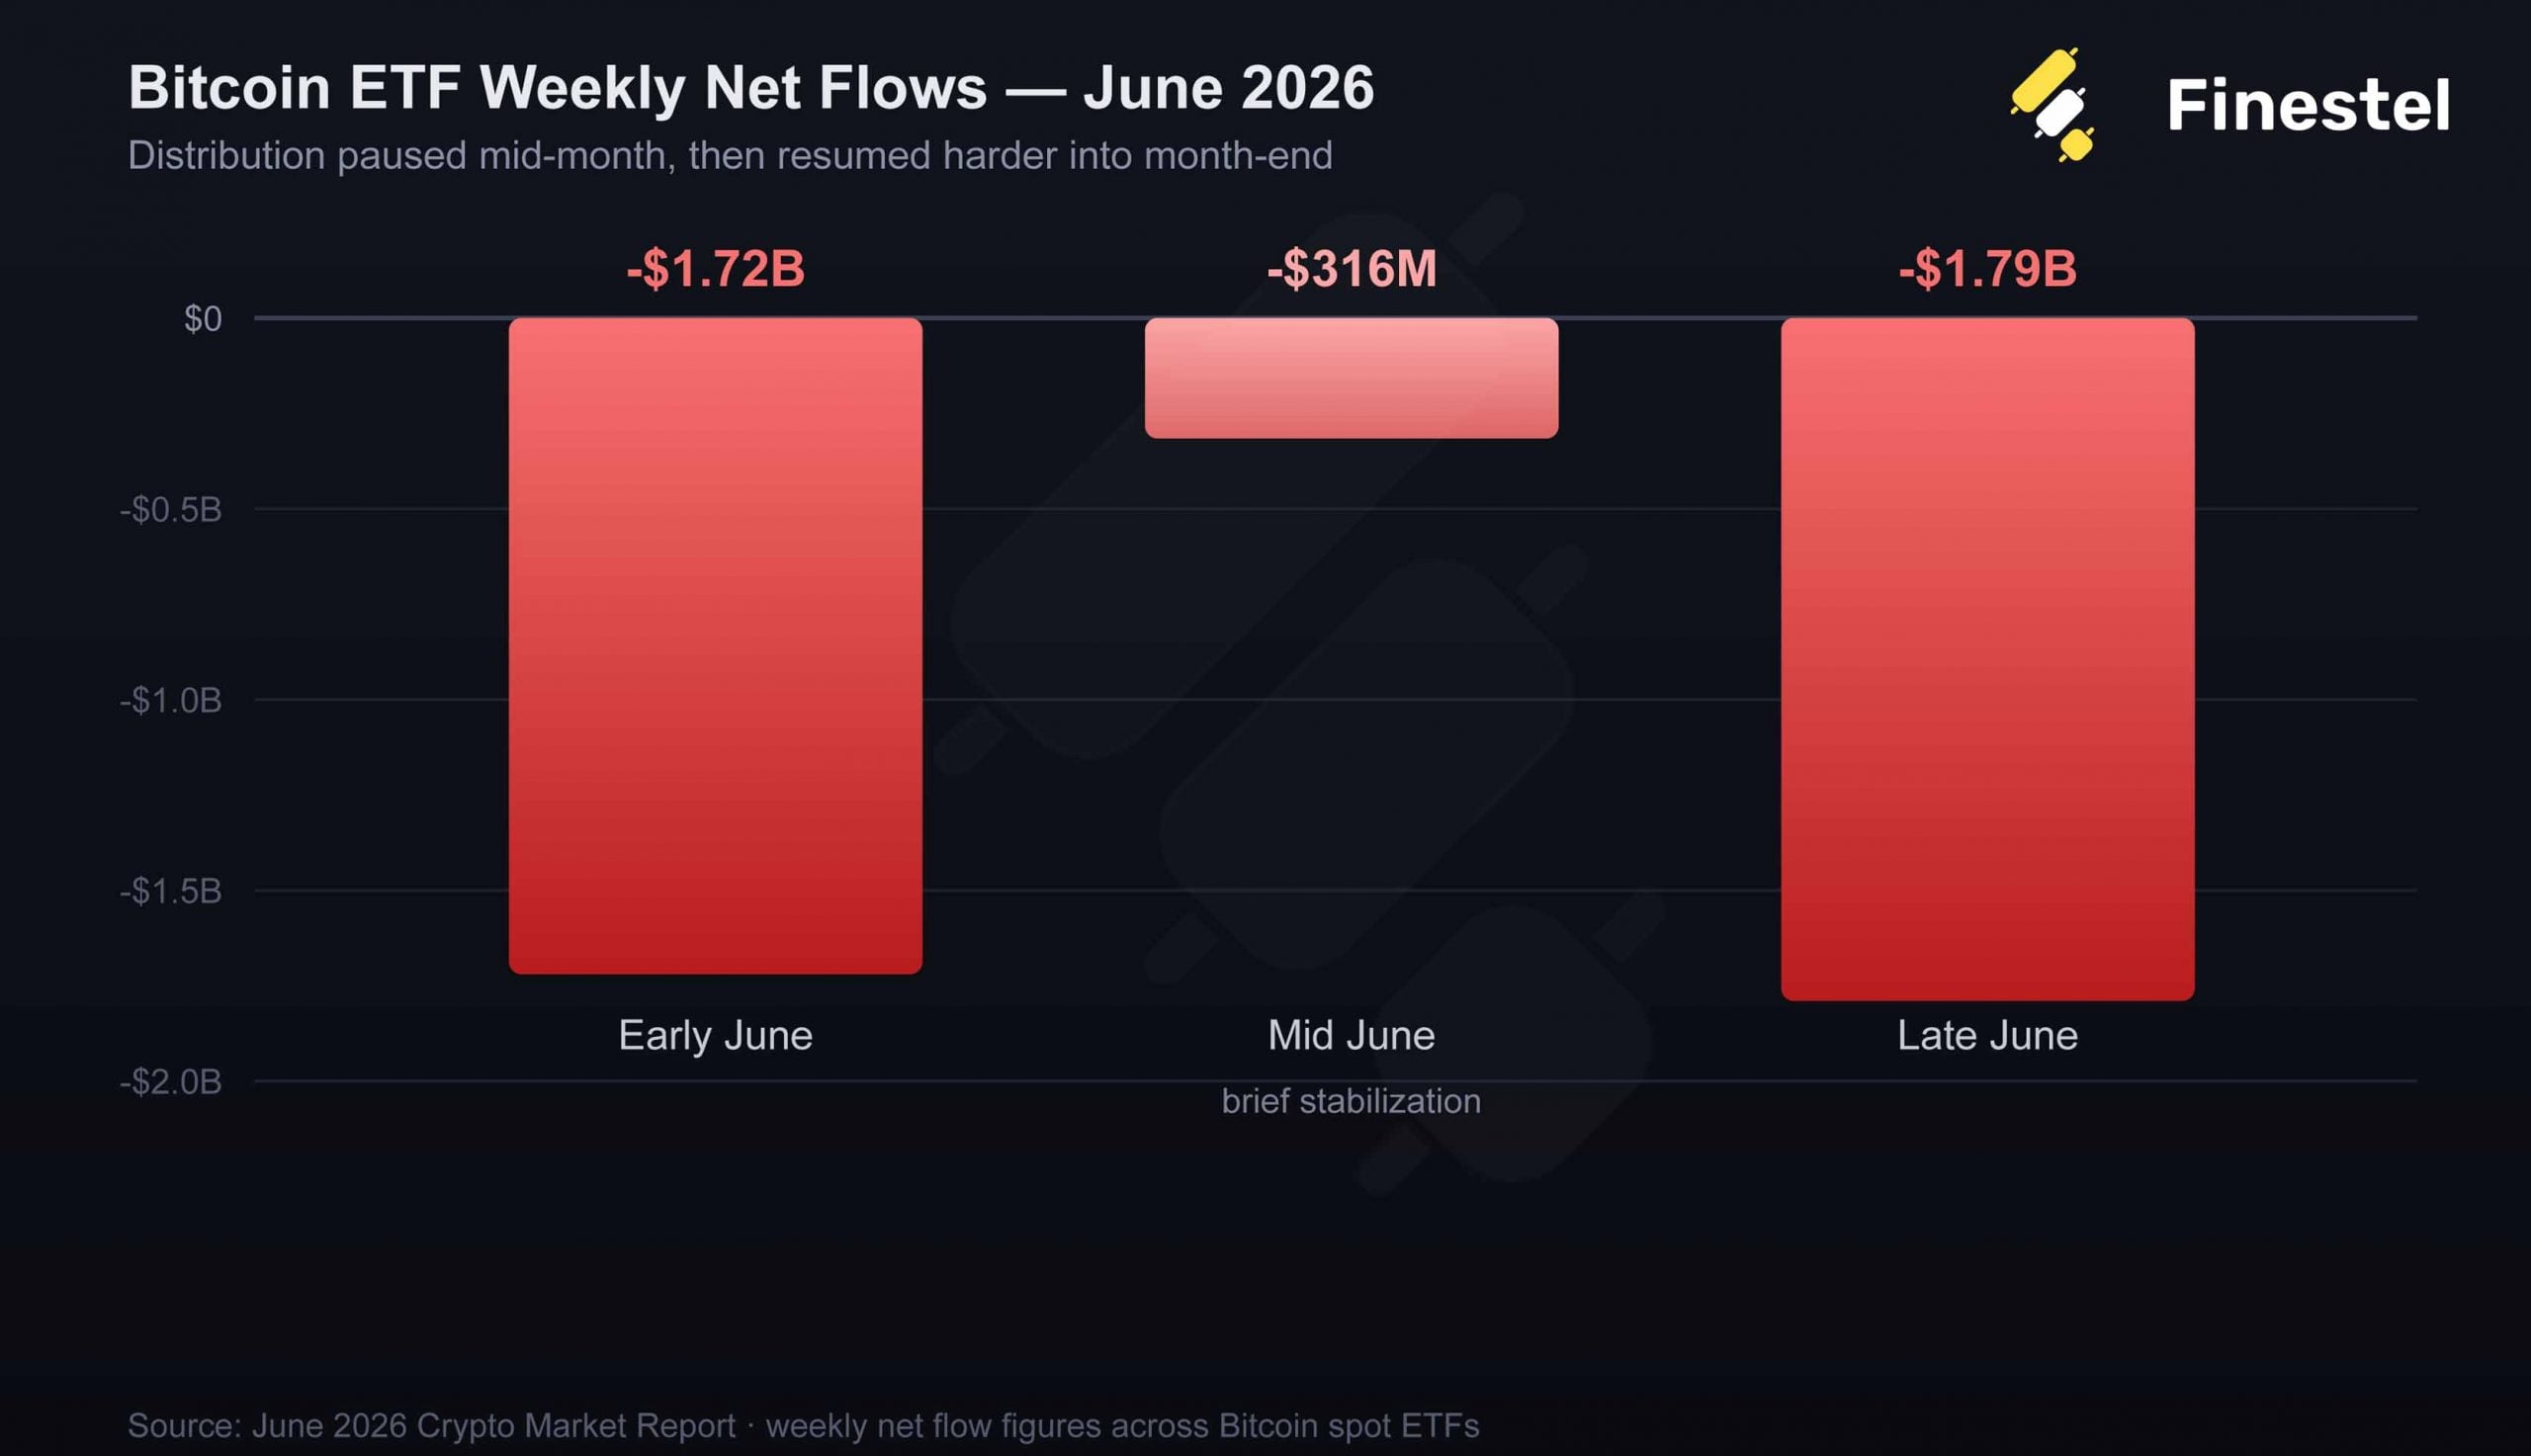
Early June saw roughly $1.72 billion in net outflows. Mid-month brought a brief stabilization, with outflows narrowing to around $316 million. Then late June reversed hard, with another $1.79 billion exiting the products. A meaningful share of that selling traced back to major institutional vehicles, including BlackRock’s IBIT.
The headline numbers matter less than the pattern behind them. This wasn’t sporadic profit-taking or a single large redemption skewing the data. It was consistent behavior: institutions used every bounce as an opportunity to reduce exposure, not to add to it. That’s the signature of a risk-off rebalancing cycle, not opportunistic dip-buying, and it’s a meaningfully different posture than what markets saw during earlier phases of this cycle, when institutional flows were a tailwind rather than a headwind.
Derivatives: Leverage Went on Strike
Bitcoin’s derivatives markets told a quieter but equally important story in June. Open interest hovered around $28–30 billion, a cycle low relative to prior expansion phases, and crucially, it stayed low even during the month’s two relief rallies. That’s the tell. When rallies happen without fresh leverage flowing in behind them, it means the move is being driven by something other than genuine risk appetite.
Funding rates spent the month oscillating between negative and neutral, punctuated by repeated liquidation cascades rather than settling into any stable positioning regime. Put together, the picture is one where upward price moves in June were largely mechanical, short covering and forced deleveraging — rather than the product of traders willingly stepping back into risk. Rallies built on short covering tend to run out of fuel fast, which lines up neatly with the three failed breakout attempts described above.
On-Chain Data: The Cost Basis Keeps Sliding
Move past derivatives and into on-chain data, and the deleveraging story becomes even more concrete.
The realized cost basis of Bitcoin sellers migrated steadily lower through the month: $63,000–$73,000 in early June, down to $62,000–$66,000 by mid-month, and $59,000–$63,000 by the close. That’s a textbook signature of higher-cost holders progressively capitulating into a weakening market; each wave of selling establishing a new, lower reference point for the next.
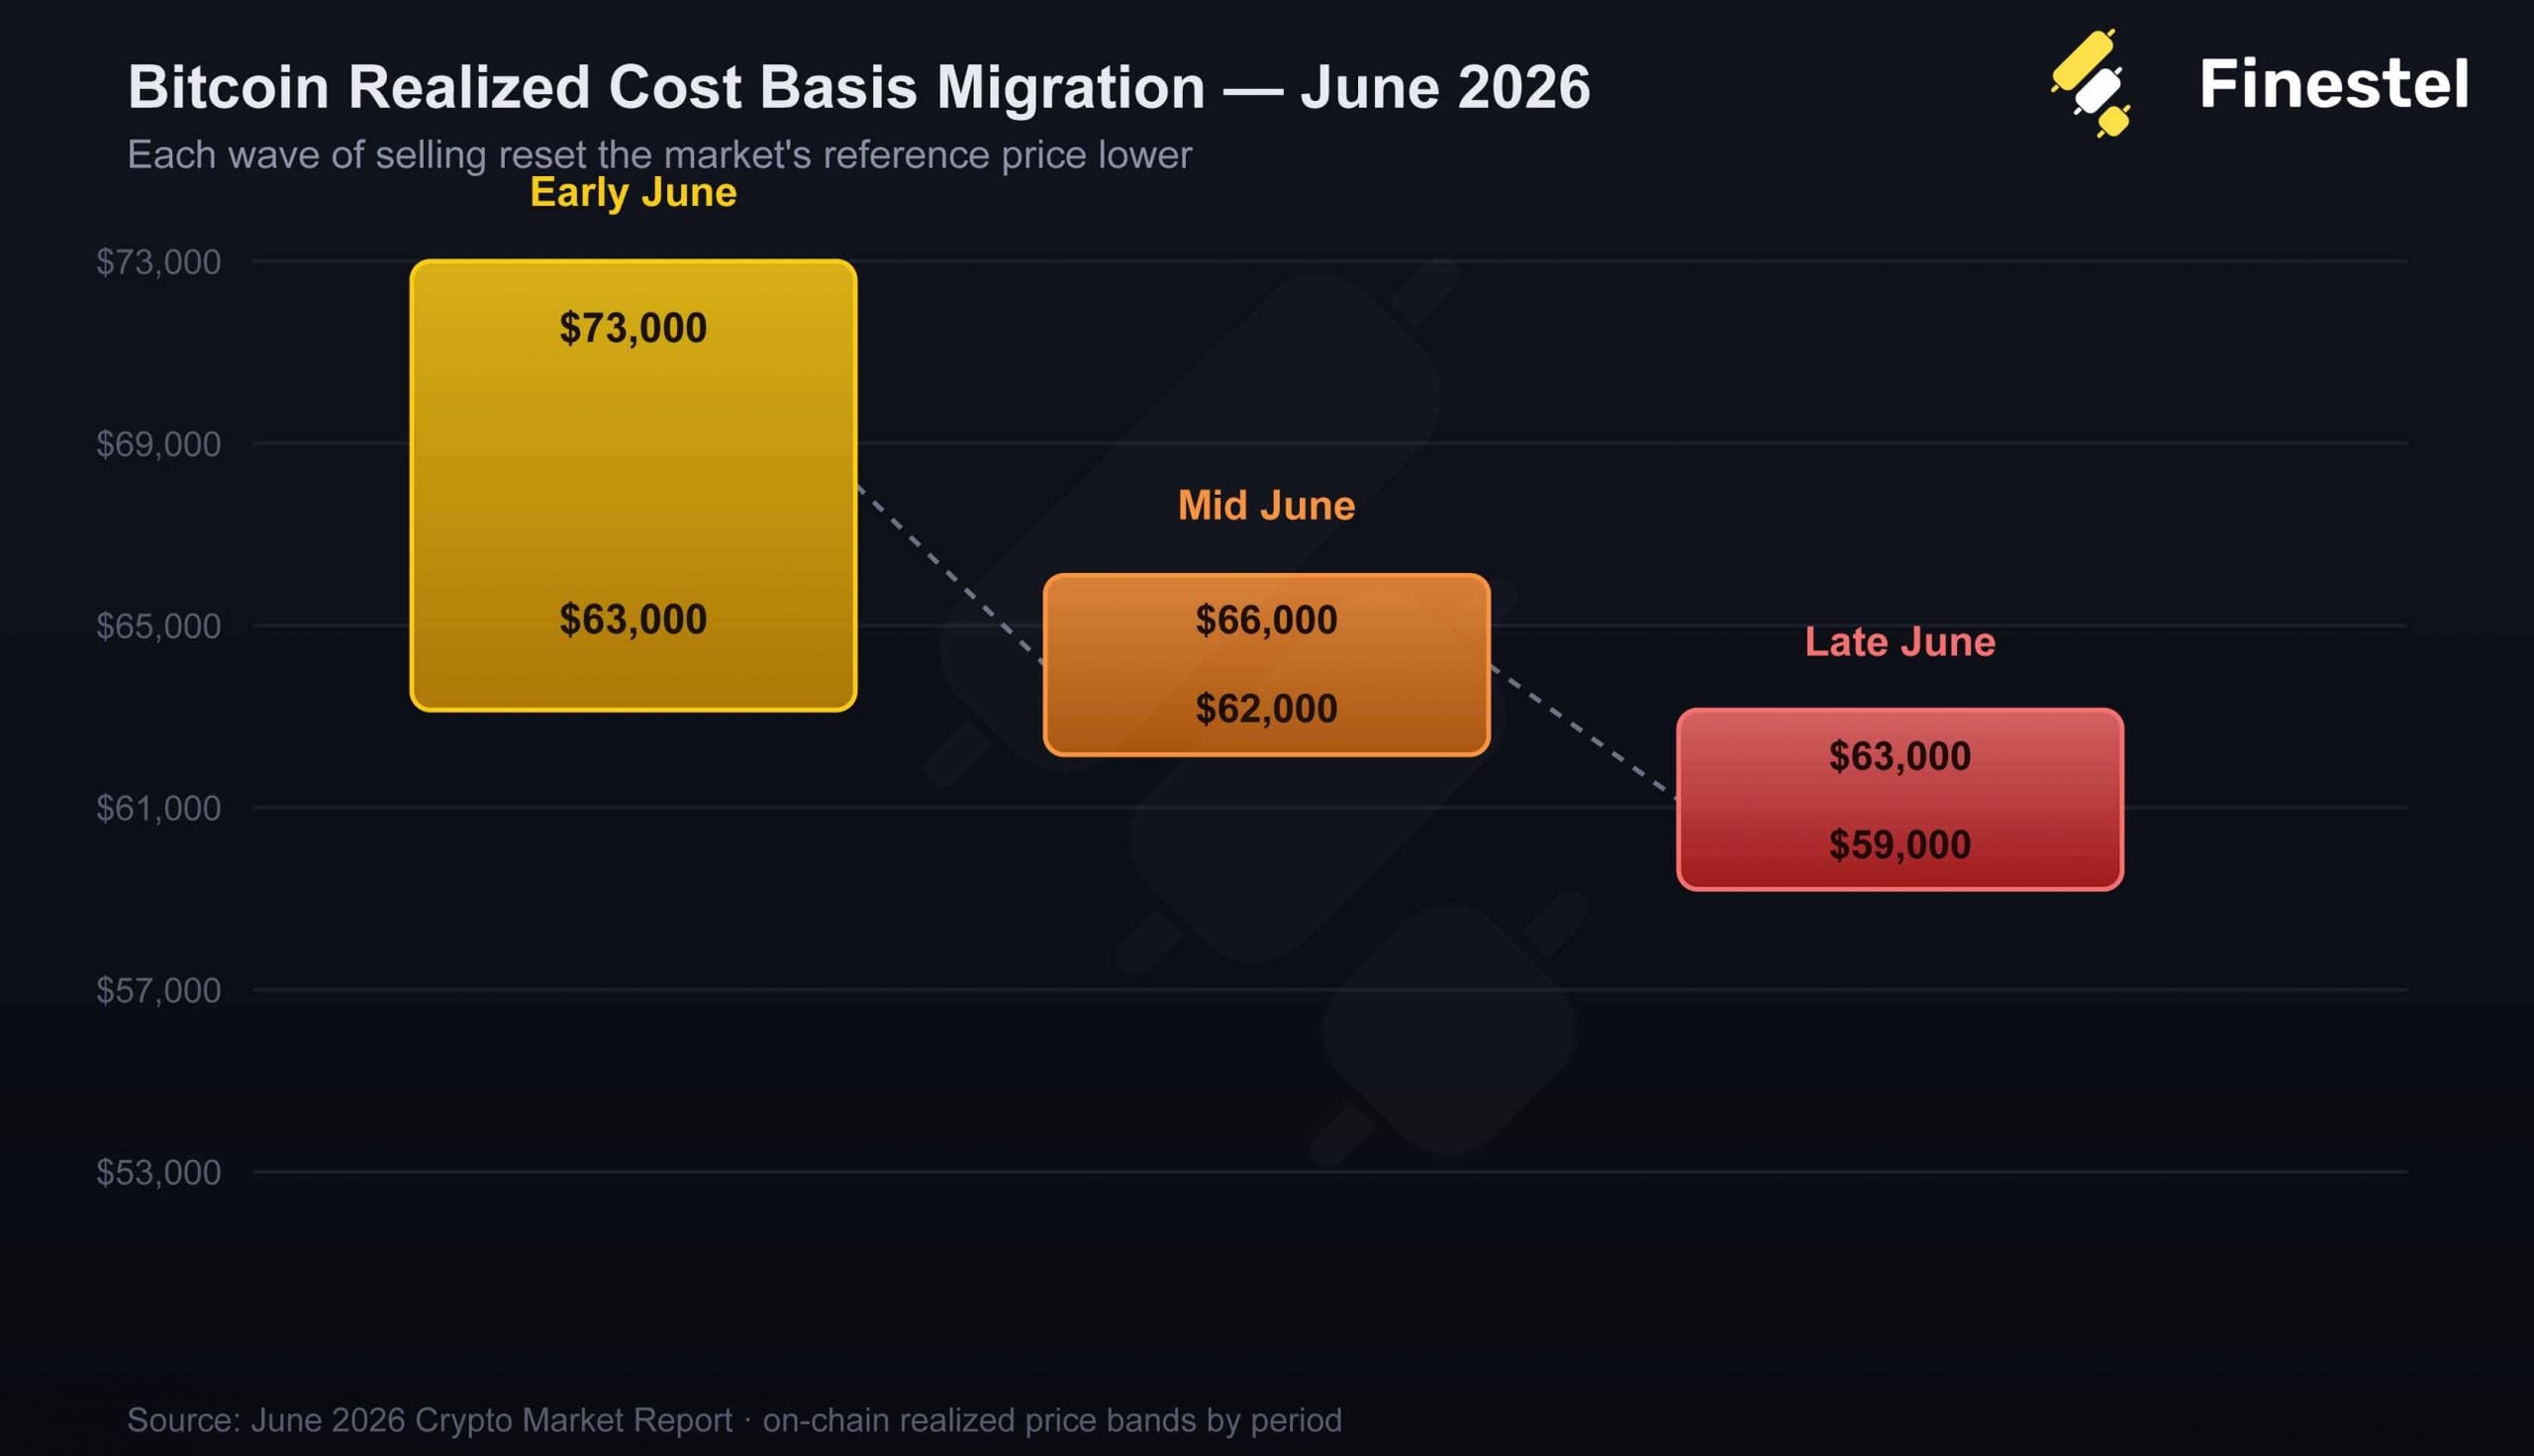
Short-term holders bore the brunt of this, realizing losses through both the mid-month and late-month drawdowns in a pattern consistent with forced exits rather than tactical repositioning. But the more structurally significant shift happened further up the chain: Long-Term Holder Net Unrealized Profit/Loss dropped into the 0–0.25 “Hope/Fear” zone for the first time this cycle. In plain terms, even the market’s most conviction-driven holders, the ones who typically shrug off short-term volatility, are now sitting on meaningfully compressed unrealized gains. Historically, that condition shows up in the middle of corrective cycles, not at terminal accumulation zones where the next leg up begins.
And the on-chain data confirms the same liquidity gap flagged in the price structure: transaction density thins out dramatically below $59,000, with the $52,000–$56,000 region standing out as a historical dead zone. If support gives way, there simply isn’t much standing in price’s way.
Read about the best On-chain analysis tools in 2026.
Capital Rotation: Bitcoin Dominance Rises as Altcoins Bleed
When markets get nervous, capital doesn’t evenly retreat; it concentrates. June was a clean demonstration of that instinct. Bitcoin dominance climbed above 61% as altcoin market capitalization contracted. Total crypto market cap fell roughly 6% over the month, but that decline wasn’t evenly distributed: Bitcoin trading volume actually rose about 18%, while altcoin volume fell around 4%.

That divergence is a flight-to-liquidity pattern, plain and simple, capital consolidating into the asset that’s easiest to enter and exit when conviction is low and uncertainty is high.
Altcoin performance wasn’t uniformly bad, though. Pockets of strength flared up around AI infrastructure, real-world asset tokenization, and privacy-focused protocols during relief phases, with names like Synapse posting sharp, narrative-driven gains. But these moves were isolated rather than systemic, narrative rotation rather than genuine liquidity returning to the broader altcoin market, which spent most of the month decaying quietly in the background.

The US Demand Problem: A 40-Day Warning Sign
One of the more underappreciated signals from June came from the Coinbase Premium Index, which stayed negative for roughly 40 consecutive trading days, one of the longest sustained negative stretches seen in recent cycles.
That’s not a minor technical curiosity. A persistently negative premium points to weak US institutional demand, an absence of marginal spot buyers stepping in to support price, and ongoing retail distribution pressure. Layer that on top of the ETF outflow data, and the conclusion is hard to avoid: US-based demand channels; historically among the most important marginal buyers in this asset class, were net-negative for essentially the entire month.
Security and Structural Risk Events Worth Noting
June also delivered a reminder that infrastructure risk hasn’t gone anywhere. Humanity Protocol suffered a serious exploit after attackers compromised employee credentials and gained access to leaked multisignature private keys, ultimately minting over one billion tokens through unauthorized bridge access and extracting roughly $36 million in value. The token collapsed by nearly 90% in the aftermath, a stark illustration of how cross-chain infrastructure and multisig security remain systemic vulnerabilities across the industry, not isolated edge cases.
Separately, Strategy’s leveraged Bitcoin treasury model came under renewed market scrutiny as participants reassessed the risks embedded in equity-linked Bitcoin exposure vehicles. No systemic stress materialized, but the episode was a useful reminder that these structures carry sensitivities that intensify precisely when markets are already under pressure.
Finestel Insider: Asset Managers Maintain Defensive Posture
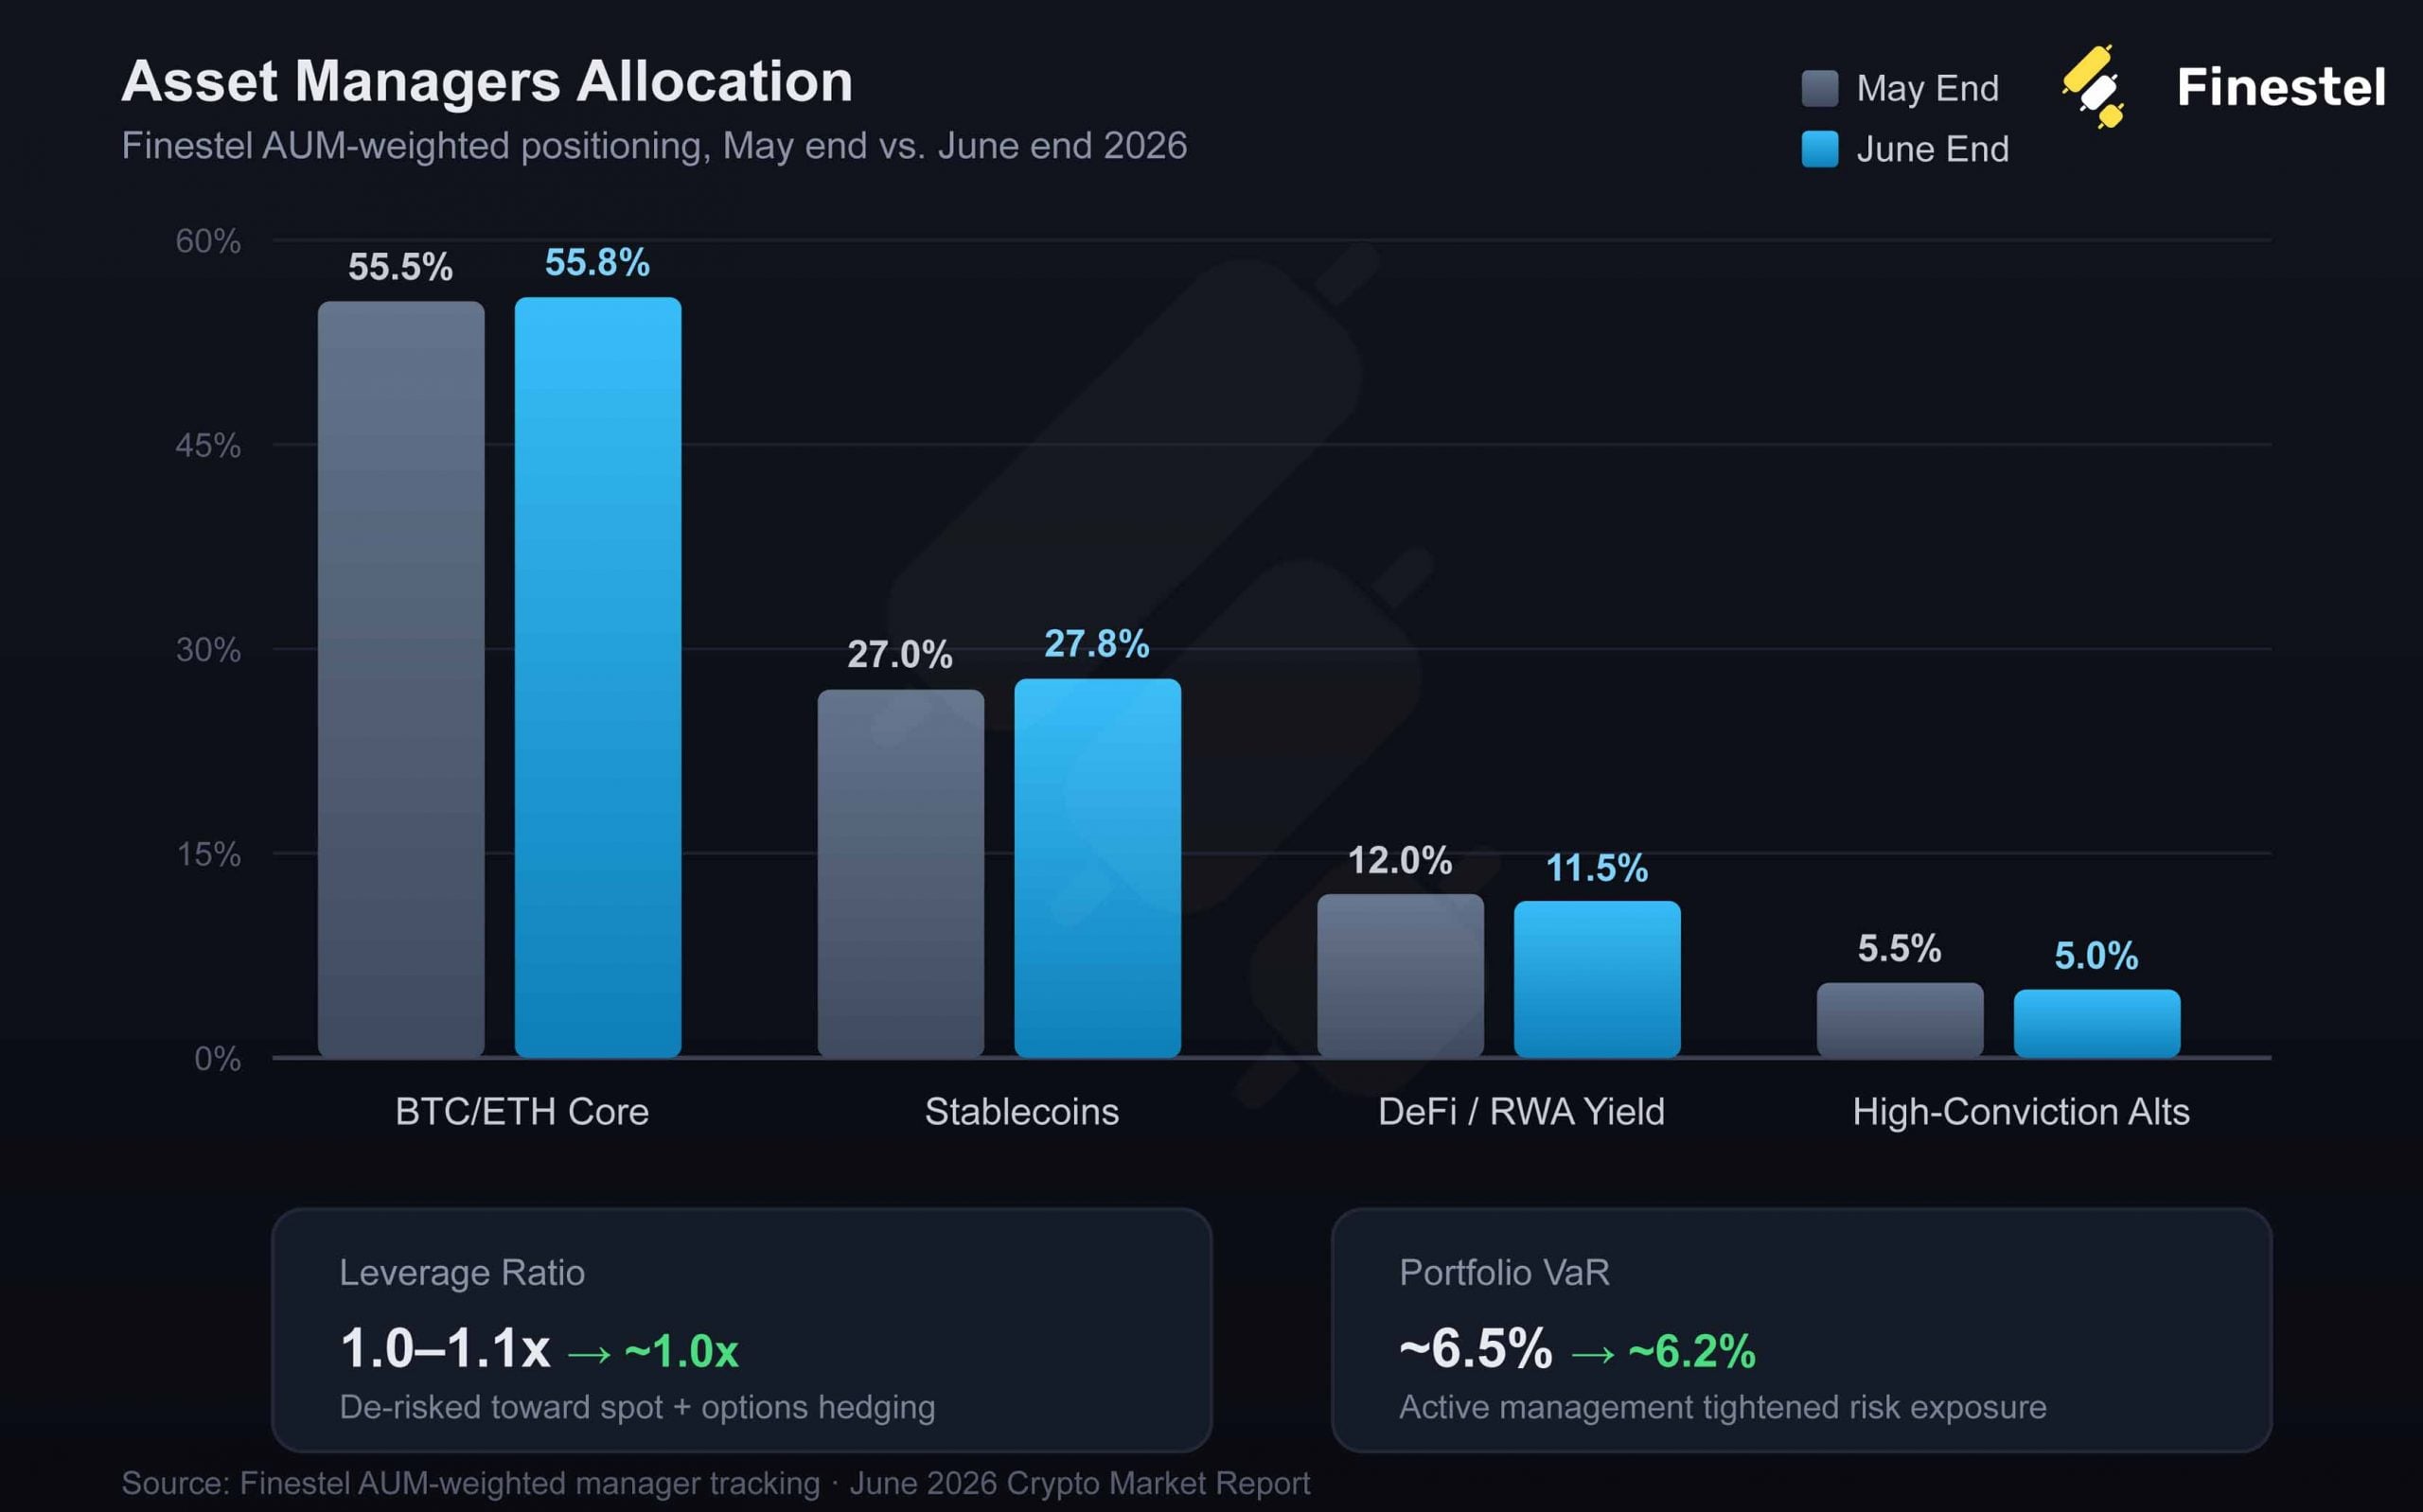
Finestel’s AUM-weighted tracking of professional asset managers revealed a continuation of the defensive rotation seen in May. Managers prioritized capital preservation and risk control amid ongoing uncertainty:
| Allocation Category | May End | June End | Net Change | Strategic Insight |
| BTC/ETH Core | 55.5% | 55.8% | ▲ Slight | Core positions actively defended as macro hedge |
| Stablecoins | 27.0% | 27.8% | ▲ +0.8% | Further increase in liquidity for volatility defense and opportunistic entries |
| Yield-bearing DeFi/RWA | 12.0% | 11.5% | ▼ -0.5% | Selective reduction in volatile yield strategies |
| High-Conviction Alts | 5.5% | 5.0% | ▼ -0.5% | Exposure trimmed to only the strongest names |
| Leverage Ratio | 1.0–1.1x | ~1.0x | ▼ De-risk | Minimal leverage with emphasis on spot + options hedging |
| Portfolio VaR | ~6.5% | ~6.2% | ▼ Tighten | Active management to lower overall risk exposure |
This disciplined approach helped professional portfolios navigate June’s volatility with relative resilience compared to broader market drawdowns. Managers used relief rallies to build cash reserves rather than chase strength, reflecting a patient, opportunistic stance.
July Outlook: Patience Remains the Core Strategy
July opens with the market in a state of extended consolidation. The US–Iran situation remains in a fragile equilibrium, while Fed policy stays highly data-dependent. Key catalysts to monitor include progress on geopolitical resolutions, upcoming inflation prints, and any shifts in monetary policy rhetoric.


Leave a Reply