April 2026 crypto market report was the most important month in recent market memory, not because it was explosive, but because it was disciplined. Bitcoin clawed back meaningful ground, institutions quietly doubled down, and the structural rot of early 2026 began to heal, even as geopolitical fires refused to go out entirely.
Coming into the month, the mood was fragile. February and March had delivered sharp drawdowns, leverage flushes, and the kind of sentiment washout that leaves investors second-guessing everything. Bitcoin was grinding below $70,000, ETF inflows had stalled, and the US–Iran conflict, with its chokehold on the Strait of Hormuz, was injecting a level of macro uncertainty not seen in years.
Then something shifted. Not dramatically. Not all at once. But week by week, the pieces fell into place: ceasefire extensions, institutional re-engagement, a “W” bottom forming on the daily chart, and Strategy executing the third-largest single-week Bitcoin purchase in its history. By April 30, Bitcoin had closed near $76,300, an approximate +11–12% monthly gain that quietly ranked among the stronger monthly performances in recent quarters.
The market didn’t roar back, it climbed back, methodically, with discipline. And that’s actually more durable than a panic-driven short squeeze.
What makes this recovery notable isn’t the price level, it’s the structure. Higher lows replaced lower lows. Positive CVD persisted across all major exchanges simultaneously for the first time since July 2025. The Coinbase premium returned to positive territory after 20 days underwater. And for the first time in months, altcoins began seeing genuine rotation rather than just meme speculation.
This is Kucoin and Finestel’s official April 2026 Crypto Market Report. It examines the drivers behind the recovery and, crucially, how professional asset managers tracked by Finestel navigated the evolving environment with discipline.
Macro & Geopolitics: The Strait of Hormuz Ran the Show
Every price move in April can be traced, in some form, back to a single 33-kilometer waterway. The Strait of Hormuz didn’t just affect oil markets; it became the dominant risk toggle for Bitcoin, US equities, and risk assets globally.

The month opened with the US–Iran conflict in a high-stakes standoff. Iran had responded to US proposals with a ten-point counter-offer. Trump threatened to destroy Iran’s oil infrastructure if no deal was reached. Then, on April 7th, just before Trump’s self-imposed deadline, a two-week ceasefire was struck. Markets breathed. Bitcoin surged past $73,000. ETF inflows jumped to a single-day record of $470 million on ceasefire day.
But the optimism was immediately tested. The Strait closed again after the Lebanon attacks. The first formal US–Iran negotiation on April 12 collapsed with both sides unmoved. By the third week, a second ceasefire extension was announced — buying time but no resolution. Iran proposed a three-phase negotiation framework (war cessation → Hormuz → nuclear), while simultaneously collecting its first “passage fee” from oil tankers, denominated in Bitcoin, though actual settlement continued in stablecoins.

Apr 21: Ceasefire extended again; Iran agrees to suspend combat
Apr 23: Iran receives first Hormuz passage fee
Apr 26: Iran proposes three-phase negotiation plan
The key insight: markets priced in ceasefire extensions as a default rather than a catalyst. By late April, each extension produced smaller price reactions, suggesting the market has found a new equilibrium around managed, unresolved tension.
On the monetary policy front, the Fed remained firmly on hold. March CPI came in above 3%, non-farm payrolls crushed expectations at 178,000 jobs, and CME FedWatch probabilities for 2026 rate cuts collapsed entirely, with the most likely first cut now priced for September 2027. The macro environment, in short, was not accommodating. That Bitcoin gained 11%+ in this context speaks to the structural demand underneath.
April 2026 Crypto Market Report: Bitcoin Price Action
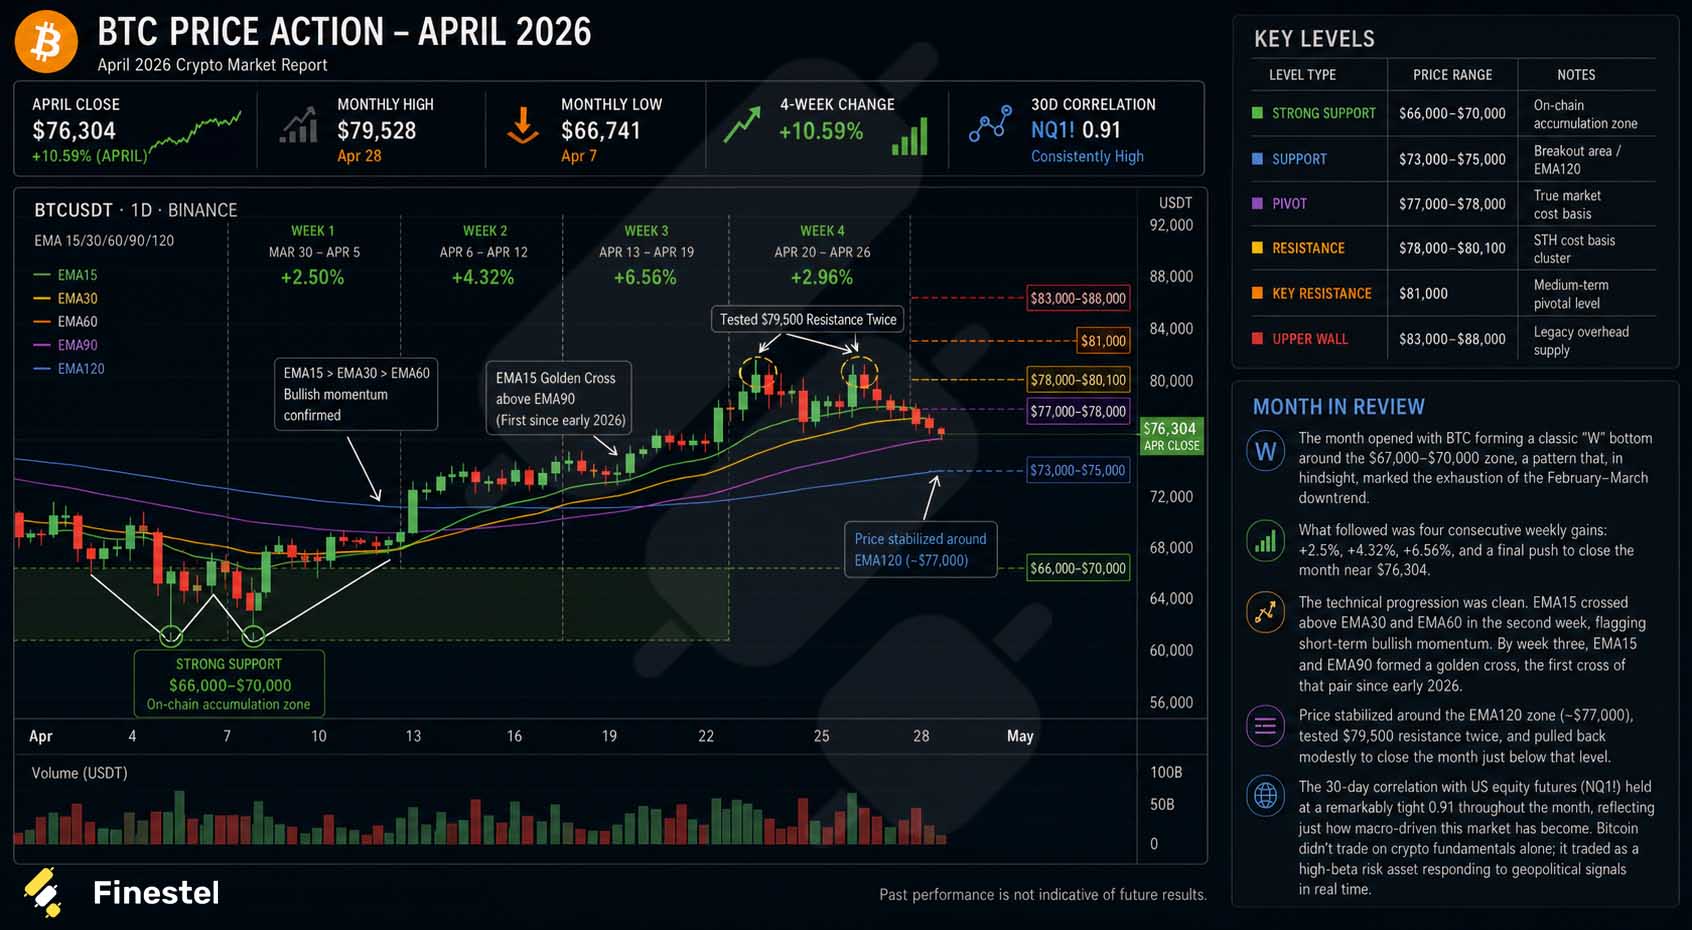
Bitcoin’s April trajectory was a textbook accumulation structure, if you knew where to look.
|
Level Type |
Price Range |
Notes |
|
Strong Support |
$66,000–$70,000 |
On-chain accumulation zone |
|
Support |
$73,000–$75,000 |
Breakout area / EMA120 |
|
Pivot |
$77,000–$78,000 |
True market cost basis |
|
Resistance |
$78,000–$80,100 |
STH cost basis cluster |
|
Key Resistance |
$81,000 |
Medium-term pivotal level |
|
Upper Wall |
$83,000–$88,000 |
Legacy overhead supply |
The month opened with BTC forming a classic “W” bottom around the $67,000–$70,000 zone, a pattern that, in hindsight, marked the exhaustion of the February–March downtrend. What followed was four consecutive weekly gains: +2.5%, +4.32%, +6.56%, and a final push to close the month near $76,267.
The technical progression was clean. EMA15 crossed above EMA30 and EMA60 in the second week, flagging short-term bullish momentum. By week three, EMA15 and EMA90 formed a golden cross, the first cross of that pair since early 2026. Price stabilized around the EMA120 zone (~$77,000), tested $79,500 resistance twice, and pulled back modestly to close the month just below that level.
The 30-day correlation with US equity futures (NQ1!) held at a remarkably tight 0.91 throughout the month, reflecting just how macro-driven this market has become. Bitcoin didn’t trade on crypto fundamentals alone; it traded as a high-beta risk asset responding to geopolitical signals in real time.
April 2026 Crypto Market Report: On-chain Context
The chip structure told a nuanced story. Early in the month, short-term selling pressure dominated in the $65k–$73k range, profit-taking and capitulation chips changing hands at a rapid clip. But as April progressed, that selling pressure shifted character: by late April, the primary source of selling wasn’t profit-takers, it was holders in the $88k range exiting with mild losses, a fundamentally different (and less aggressive) dynamic.
Meanwhile, new accumulation concentrated in the $77k–$78k range, with the EMA120 acting as a support magnet. The URPD structure confirmed gradual improvement: the gap between $74k–$80k filled steadily across the month, and support levels moved progressively higher. Long-term holder behavior showed early stabilization signs, not yet accumulating aggressively, but no longer distributing either.

Capital Flows & Institutional Activity
The most important thing to understand about April’s recovery is that it wasn’t retail-driven. The structural demand came from institutions, and one company in particular made history doing it.
|
Period / Event |
Net Inflow / Purchase |
Key Details |
|
Week of Apr 5–12 |
$786M |
Bitcoin ETF weekly net inflow. Single-day spike of $470M on ceasefire day, highest daily inflow in ~6 weeks. |
|
Week of Apr 13–19 |
$996M |
ETF weekly record for the quarter. $663M single-day on Hormuz Strait reopening, three-month high daily inflow. |
|
Week of Apr 20–26 |
$823M |
Nine consecutive days of ETF net inflows, longest streak of the year. Steady institutional accumulation. |
|
Strategy (Apr 13–19) |
$2.54B |
34,164 BTC purchased at an average of $74,395. Third-largest single-week buy in company history. Total holdings now 815,061 BTC. |
Strategy’s April behavior deserves special attention. The firm didn’t just buy Bitcoin, it upgraded its capital structure to buy it faster. A proposal to increase STRC preferred stock dividend frequency to bi-weekly (from monthly) was put forward for shareholder vote in June, a move specifically designed to accelerate financing velocity and, by extension, Bitcoin accumulation pace. This is long-term thinking, not opportunistic trading.
Beyond Strategy, the institutional recovery showed breadth: Capital B, ANAP Holdings, The Smarter Web, Strive, and Hyperscale Data all continued steady position-building across the month. Goldman Sachs announced plans to launch a “Bitcoin Premium Income ETF.” Morgan Stanley advanced its Bitcoin Spot ETF toward NYSE listing. Schwab announced the launch of spot cryptocurrency trading services. BlackRock’s IBIT options position surpassed Deribit — a landmark in the institutionalization of Bitcoin derivatives.
The signal isn’t just that money flowed in, it’s that new distribution channels kept opening. Each new institutional product means the next wave of capital has an easier on-ramp.
One important nuance: regional differentiation. Non-US markets (primarily Binance) led the early recovery in buying pressure. US institutional flows, as measured by Coinbase CVD and the Coinbase premium index, lagged noticeably. The Coinbase premium was negative for roughly 20 consecutive days before recovering. This asymmetry explains why the recovery, while real, lacked the explosive velocity that US institutional capital typically provides. The full re-engagement of American institutional demand remains the key upside catalyst for May.
April 2026 Crypto Market Report: Market Structure & Sentiment
Global spot CVD (Cumulative Volume Delta) remained positive throughout April, one of the clearest signals that dip-buying was dominant. After April 7th, global CVD held consistently around 800, a level near its six-month high, and remained in that range even through the failed negotiations of April 12.
The landmark structural moment came mid-month: for the first time since July 2025, Binance, Coinbase, and the overall market CVD all turned simultaneously positive. Regional capital differentiation, a chronic weakness since late 2025, was converging. This convergence matters because sustainable bull runs require coordinated demand, not one region carrying the load.
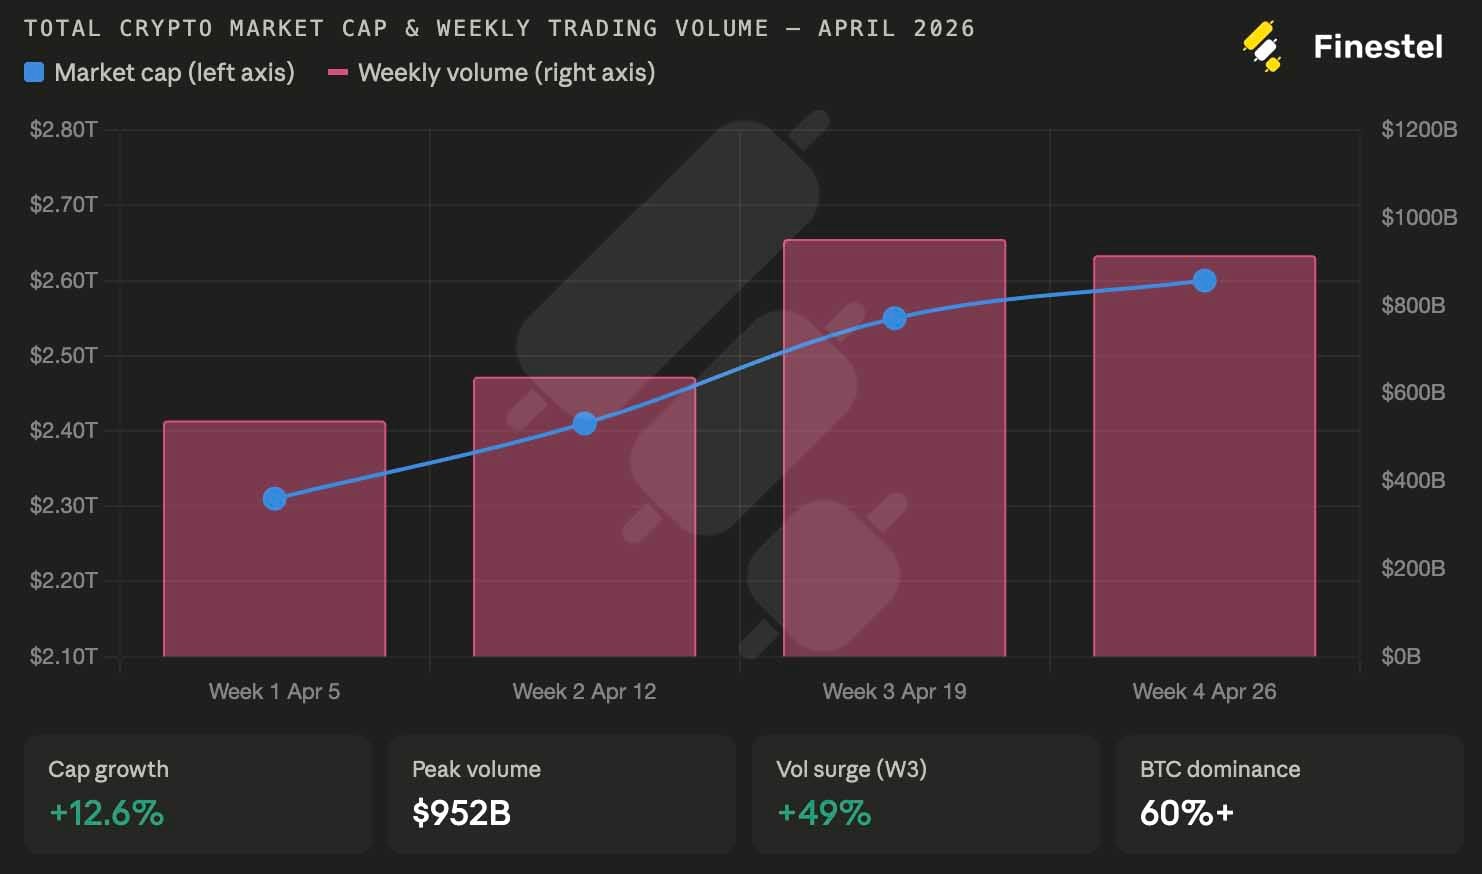
Total crypto market capitalization climbed from $2.31T (April 5) to $2.60T (April 26), a 12.5% expansion. Weekly trading volume showed the clearest weekly progression of the month, peaking in the week of April 13–19 with a 49% surge that pushed altcoin weekly volume to a two-month high.
Bitcoin’s market cap dominance continued rising, crossing 60% by the final week of April. This is a characteristic pattern of early recovery phases: capital first flows into the liquidity anchor (BTC), then rotates outward. That rotation was just beginning to materialize in the final week of April, a potential leading indicator for altcoin season dynamics in May.
Leverage metrics, meanwhile, showed significant improvement. The leverage reset that had been underway since February was largely complete by month-end, leaving the market in a structurally cleaner position. Options markets showed rising open interest without the extreme funding rate distortions seen in earlier frothy periods — healthier foundations for sustained movement.
One concern persisted: Bitcoin’s “price up, volume down” pattern in the final week of April, where BTC trading volume dropped 18.32% MoM even as price pressed higher. This divergence traditionally calls for confirmation on any breakout above $79,500.
Altcoin Landscape
The altcoin market in April was a tale of two dynamics: genuine narrative-driven moves in names with real catalysts, and a turbocharged meme machine feeding on recovering sentiment. Both were present simultaneously, and distinguishing between them matters enormously for sizing risk.
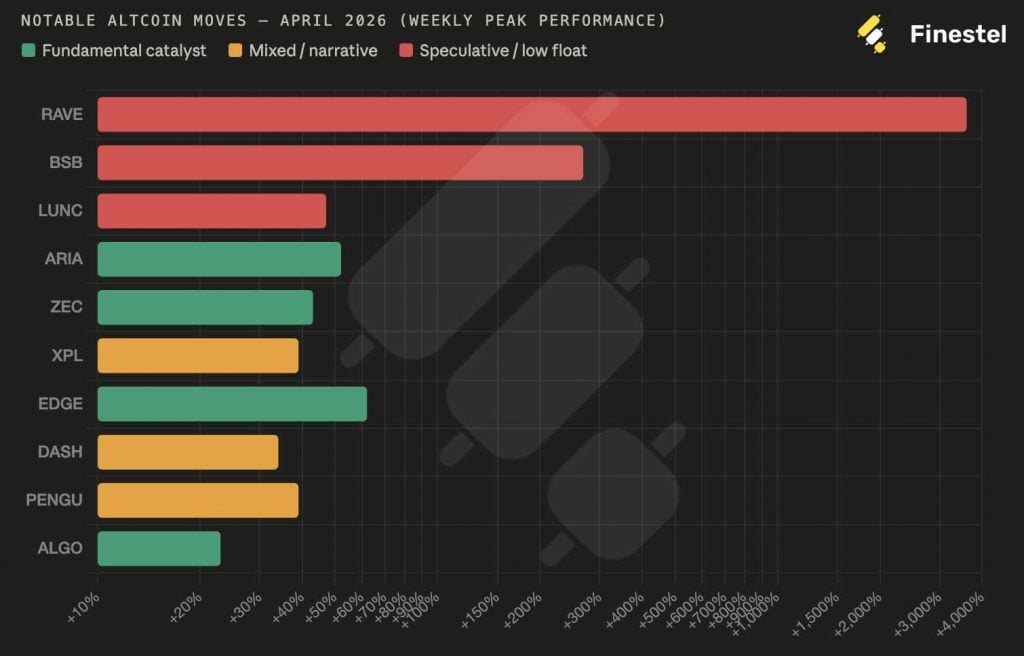
The clearest theme in early April was event-driven speculation concentrated in “ultra-high-elasticity” assets with low float and concentrated ownership, a setup that, when triggered by social media amplification, produces violent but often short-lived moves. The AI sector (ARIA, SIREN) and privacy coins (ZEC, DASH) showed more fundamental underpinnings. Mid-April brought capital rotation into meme coins and older cycle assets: Binance Life (+204%), ORDI, SATS, PNUT, NEIRO. By late April, the rotation broadened further into DeFi stalwarts (OHM, LUNC, STABLE) and GameFi (AXS, PENGU, SPX).
|
Token |
Project |
Narrative Label |
Monthly Move |
Key Drivers |
Notes / Risk |
|
RAVE |
RaveDAO |
The 36× Anomaly |
+3,599% |
24% float, concentrated chip structure, 20,000× surge in social engagement |
Capital-driven artificial squeeze. Peaked near $10 from $2, now ~$9. High-risk, not a template. |
|
ZEC |
Zcash |
The Institutional Catalyst |
+42.8% |
Grayscale ZCSH ETF filing, privacy pool utilization up 11% → 30%+ |
Stronger fundamentals + institutional pathway. More durable narrative. |
|
ARIA |
Aria.AI |
The AI Gaming Thesis |
+51.7% |
16M tokens withdrawn from Binance (21.4% of float) in 24h, whale accumulation + AI gaming rebound |
Hit $1.00, consolidating $0.83–$0.85. More structural than most. |
|
BSB |
Block Street |
The Controlled Surge |
+268% |
99.92% supply whale-held, staking + narrative release, volume 5× weekly average |
Small-cap “pump and tell” structure. Proceed with caution. |
|
EDGE |
edgeX |
The DEX Resurgence |
+62.1% |
$74B 30-day volume (#2 perp DEX), token buyback (Apr 1), multi-exchange listing |
Real revenue + real buyback. One of the most fundamentally supported April movers. |
|
ALGO |
Algorand |
The Quantum Narrative |
+23.1% |
Mentioned in Google Quantum AI paper, Revolut staking launch (70M+ users) |
Dual catalyst: tech credibility + distribution. |
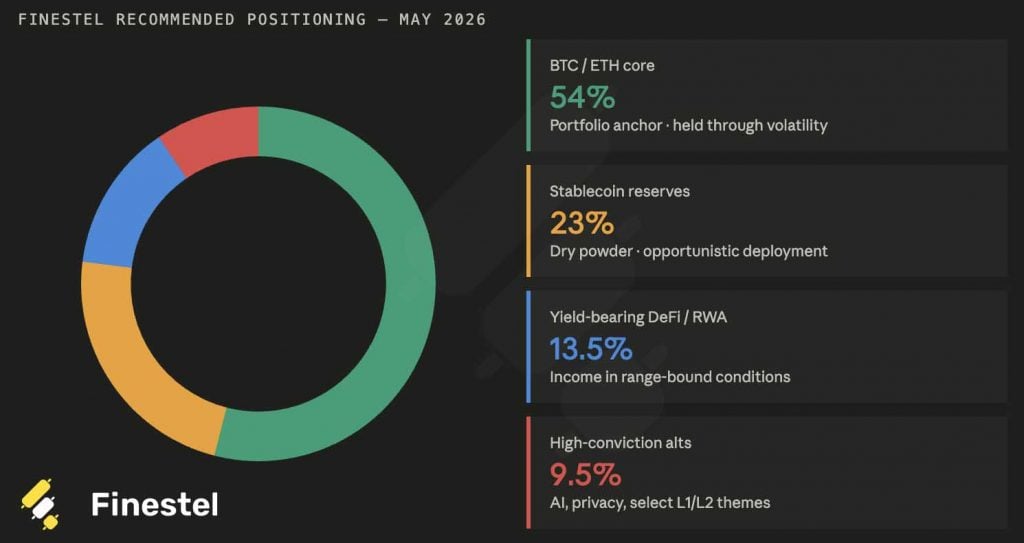
Finestel’s Asset Managers’ Behavior: Discipline Over FOMO
Finestel’s AUM-weighted data across tracked professional asset managers revealed a consistent playbook throughout April, one defined by patience, selective participation, and proactive hedging rather than reactive chasing.
| Allocation Category | March 2026 | April 2026 | Change | Commentary |
|---|---|---|---|---|
| BTC/ETH Core | 53.5% | 54.5% | +1.0% | Increased on dips; viewed as the highest-conviction anchor amid improving structure |
| Stablecoins | 28.0% | 23.0% | -5.0% | Selective deployment into strength; reduced dry powder as confidence returned |
| Yield-bearing DeFi / RWA | 13.0% | 13.5% | +0.5% | Slight increase for consistent yield in still range-bound environment |
| High-Conviction Alts | 5.5% | 9.0% | +3.5% | Targeted rotation into AI infrastructure, privacy, and select L1/L2 plays |
| Total | 100% | 100% | – | Risk appetite increased modestly but remained disciplined |
The asset managers who navigated April most effectively were those who had already done their risk management work in February and March. Having de-risked proactively during the drawdowns, they entered April with dry powder; stablecoin reserves that gave them the flexibility to buy on weakness rather than capitulate on strength. When Bitcoin dipped to $67,000–$70,000 in early April, they were buyers, not sellers.
The best performing managers in April weren’t the ones who predicted the rally, they were the ones who were prepared for it, having avoided the panic selling that wiped out less disciplined portfolios in February and March.
Their tactical behavior across the month followed a clear pattern: defending or modestly adding to BTC/ETH core positions on dips; maintaining 22–24% stablecoin reserves rather than deploying everything at once; keeping leverage low and using options to hedge around negotiation headlines and CPI prints; and rotating incrementally — not aggressively — into yield-bearing DeFi/RWA and select AI infrastructure, privacy, and Layer 1/2 altcoins as sentiment improved.

May 2026 Outlook: Structural Progress, But the Test Is Ahead
May begins with Bitcoin in a better structural position than at any point since late 2025. But “better” is not the same as “clear.” The path higher requires catalysts that haven’t materialized yet, and multiple scenarios remain genuinely plausible.
The bull case hinges on a decisive close above $81,000 on strong volume, the level that would signal a structural breakout from the current range and open a clear path toward the $83,000–$88,000 supply zone. The ingredients for such a move exist: ETF inflows are consistent, institutional allocation is recovering, leverage has reset, and a full US–Iran resolution would eliminate the largest remaining macro tail risk in a single headline.
The additional catalyst that could supercharge this: US institutional capital finally returning in force. Coinbase CVD lagged Binance throughout April, a gap that, once closed, typically accelerates moves significantly. The approaching vote on Bitcoin in 401(k) plans, combined with multiple new institutional product launches (Goldman’s Bitcoin Income ETF, Morgan Stanley’s spot ETF), creates a structural bid that hasn’t fully manifested yet.
The bear case is simpler: failure to hold above $73,000–$75,000 on any meaningful selling pressure. The $78,000–$80,100 resistance band remains dense with short-term holder cost basis, and absent fresh institutional demand, that zone could cap price and trigger a rotation back down. A deterioration in US–Iran talks, a hot CPI print, or an unexpected deleveraging event in DeFi could all serve as triggers.
The honest assessment: the market has made structural progress that matters, but is not yet in a trending bull market. It’s in a high-quality recovery that requires confirmation. The key variables are: (1) Can price sustain above $77,000? (2) Does US institutional capital re-engage? (3) Does the geopolitical situation evolve toward resolution rather than escalation?
What to Watch in May: The Catalysts That Could Move Markets
| Event / Catalyst | Potential Impact | Direction |
|---|---|---|
| US–Iran Second Round Negotiations TBD, the highest priority event of May |
Full resolution would eliminate the largest macro tail risk — likely triggering a major ETF inflow wave and risk-on rally across all assets. | Bullish on deal |
| FOMC Interest Rate Decision April 29, rates expected to remain unchanged |
No cut expected. Hawkish rhetoric could briefly pressure risk assets. Any dovish signal would be a surprise catalyst. | Neutral / Risk |
| US Q1 GDP Preliminary Estimate April 30 |
Weak print could reignite rate-cut speculation; strong print confirms Fed hold. High uncertainty for macro-correlated assets. | Two-way risk |
| BTC Options Expiry $7.9B concentrated expiry, Apr 25 passed, next cycle building |
$75,000 was the max-pain level for late April expiry. New positioning around $78k–$80k will shape near-term volatility profile. | Tactical watch |
| Digital Asset Market Clarity Act Senate vote delayed to May |
Passage would be a landmark structural catalyst for institutional confidence. Banking lobby opposition remains the key obstacle. | Bullish on passage |
| Goldman / Morgan Stanley Bitcoin Product Launches H2 2026 timeline advancing |
Each new institutional distribution channel expands the addressable investor base. Bitcoin Income ETF and spot ETF represent significant new demand. | Structurally bullish |
| HYPE Token Unlock, $409M April 29 |
Large unlock events can create localized selling pressure and short-term price suppression in the unlocked asset. | Asset-specific risk |
April 2026 Crypto Market Report: Final Thought
April didn’t hand anyone easy money. It rewarded preparation.
The market that emerged from February and March’s wreckage was a different animal, chastened, structurally cleaner, and far more sensitive to macro signals than it had been in the momentum-driven days of late 2025. What April proved is that Bitcoin can absorb genuine adversity: persistent inflation, delayed rate cuts, two failed geopolitical negotiations, and a global chokepoint that refused to fully reopen. It absorbed all of that and still closed the month up 11%.
But context matters. This wasn’t a bull market resumption, not yet. It was a recovery with architecture.
Heading into May, the structure is better, but the questions are bigger. Can Bitcoin close convincingly above $81,000 on volume? Will US institutional capital, which visibly lagged non-US flows throughout April, finally re-engage in force? Does the US–Iran situation evolve toward resolution, or does it calcify into a permanent geopolitical tax on energy and risk appetite alike? And can the Fed find any room to shift its tone, even marginally, as the cumulative weight of energy-driven inflation begins to drag on an already fragile consumer?
None of these questions has clean answers today. Stay sized for the uncertainty. Stay ready for the upside.


Leave a Reply