
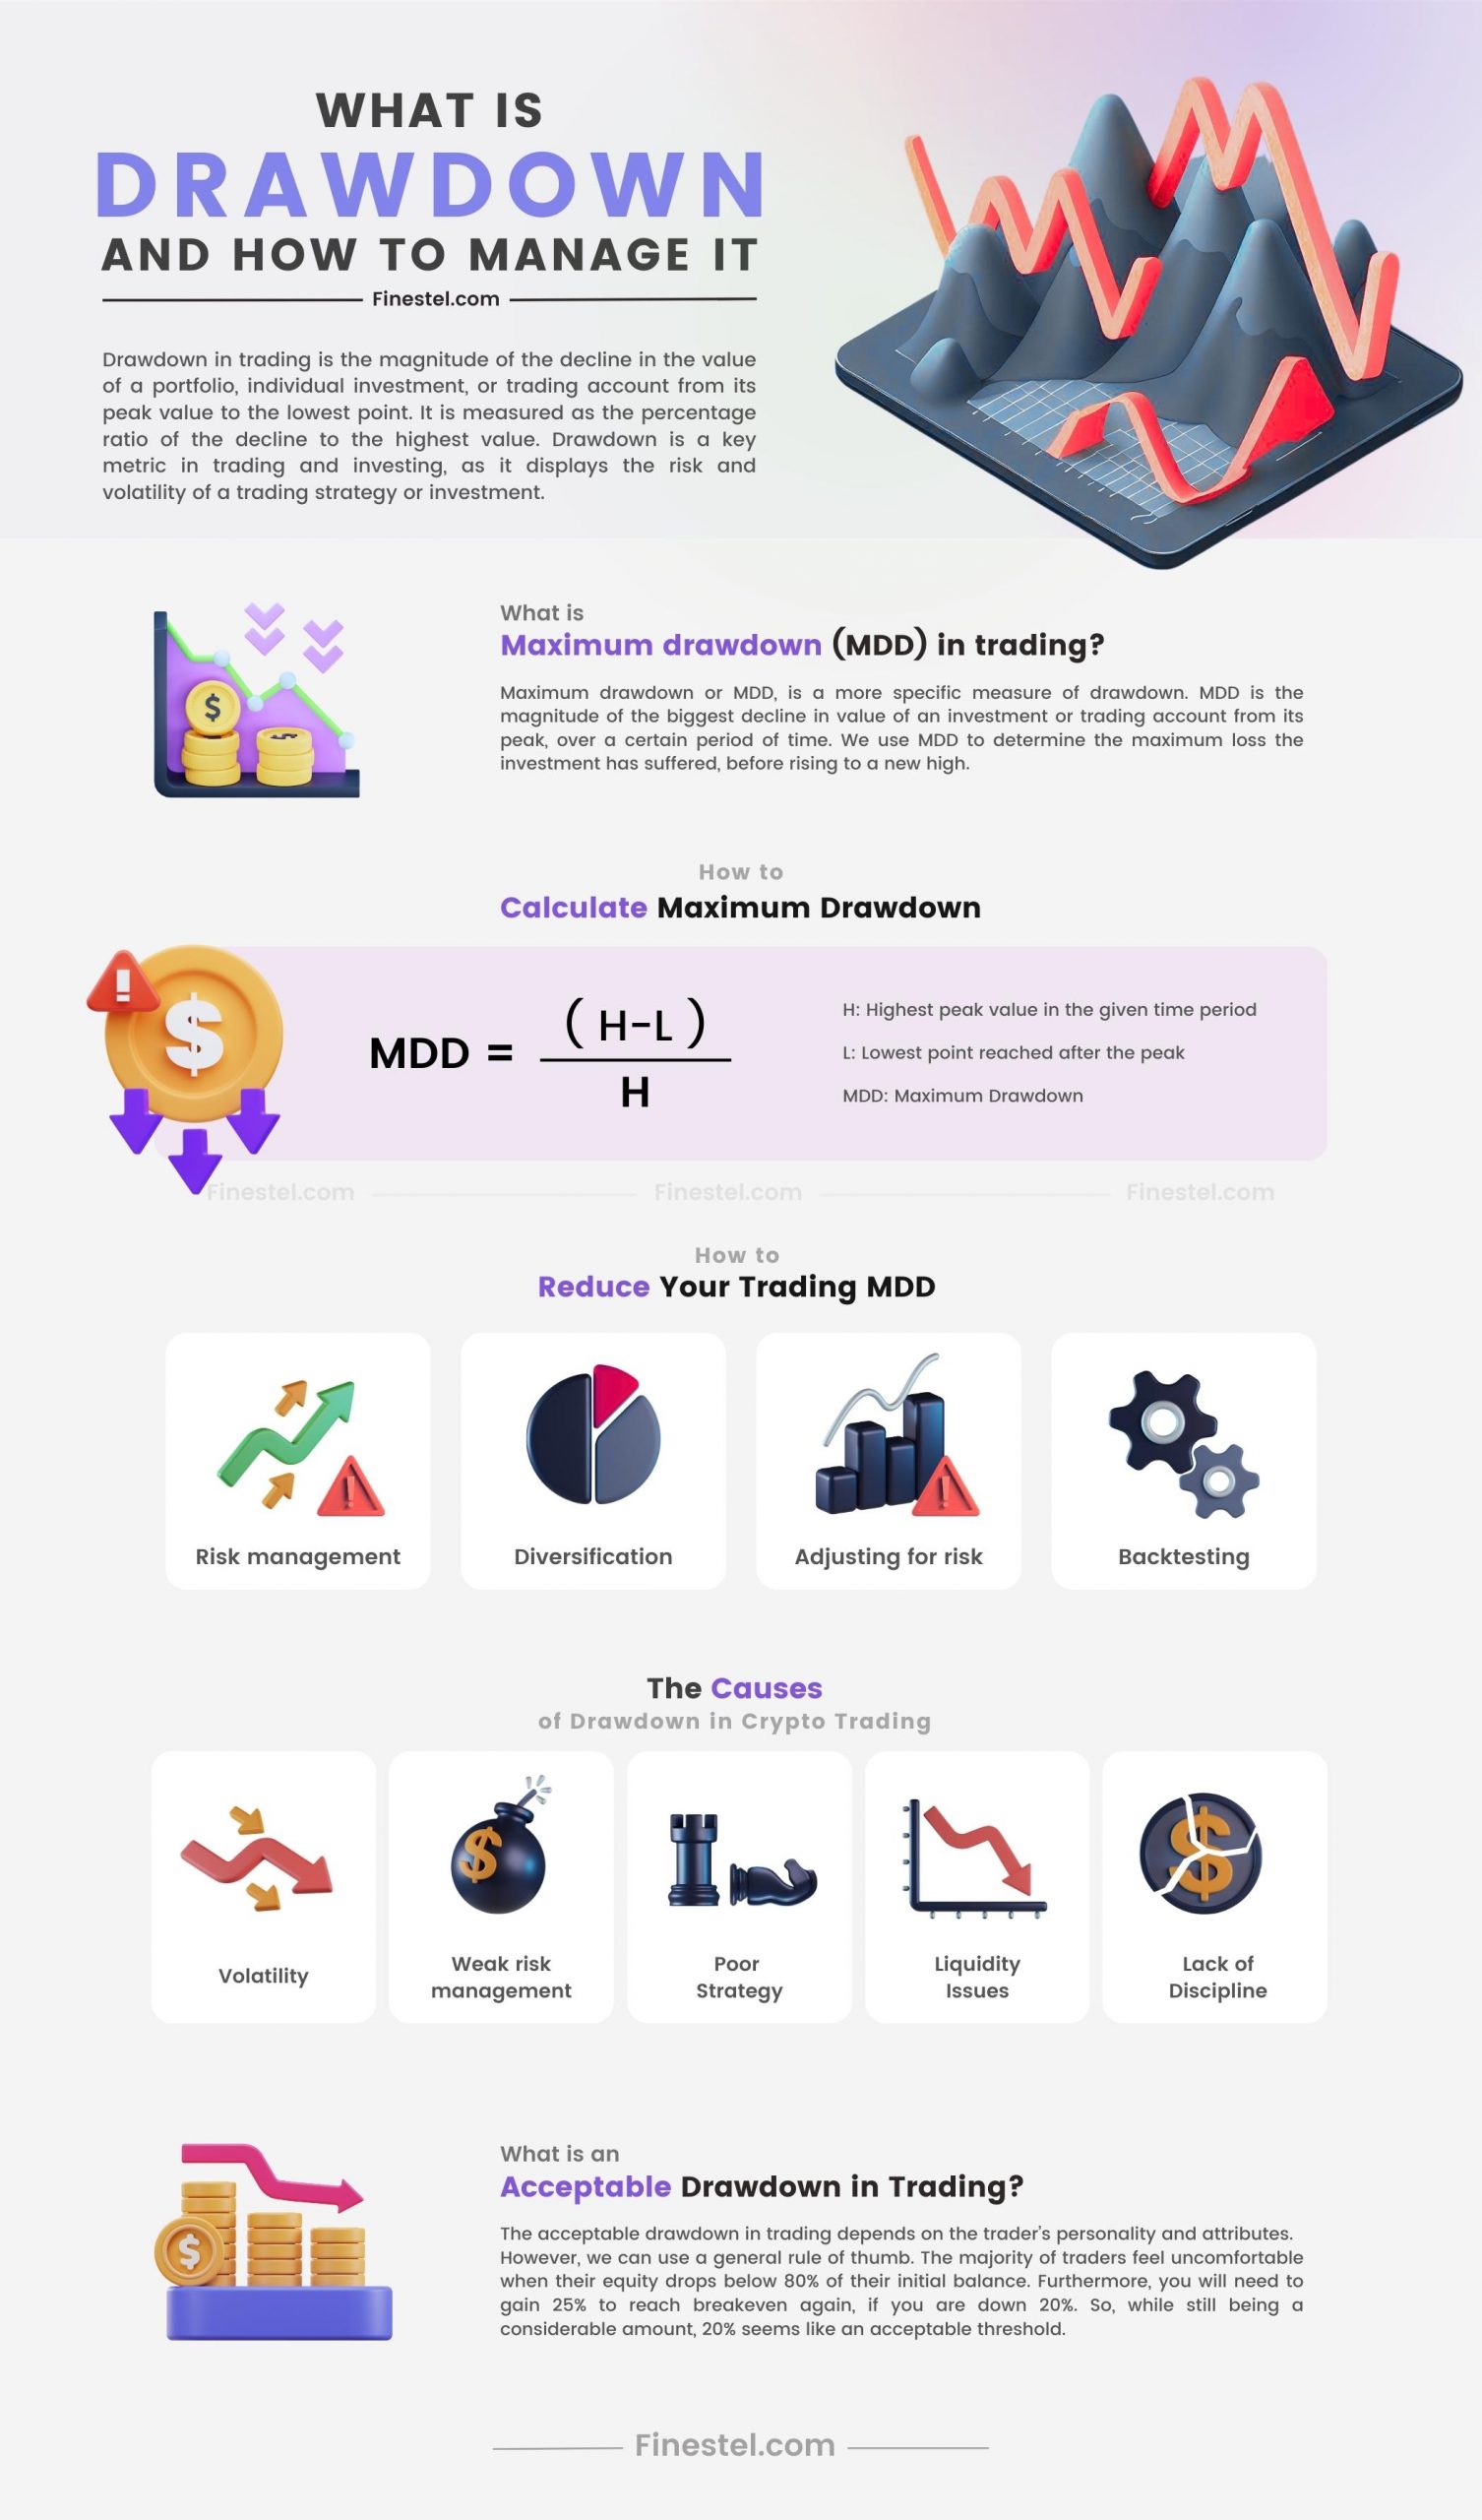
Drawdown in trading is the magnitude of the decline in the value of a portfolio, individual investment, or trading account from its peak value to the lowest point. It is measured as the percentage ratio of the decline to the highest value. Drawdown is a key metric in trading and investing, as it displays the risk and volatility of a trading strategy or investment.
In this article by Finestel, we begin by providing a clear definition of drawdown, how it’s calculated, and what it means for the trader. We then dive deeper by introducing additional concepts like maximum drawdown and their use cases Finally, we make some suggestions on how to manage your drawdown in crypto trading.
What is the Definition of Drawdown in Trading?
Drawdown in trading is the magnitude of the drop in an investment or trading account’s value from the highest point to the lowest before recovering. So, drawdown should always be calculated after the account has initiated its recovery phase. Drawdown is usually presented in percentages and is calculated by dividing the distance between the peak and the low by the peak value itself.
Drawdown is an essential metric in risk management and trading strategy evaluation. The more drawdown your portfolio or trading account experiences, the riskier and more volatile your strategy or investment is. Therefore, calculating the drawdown associated with your trading system can provide beneficial insights and help in optimizing your risk management process.
What Drawdowns Tell You
Being an important metric in every trader or investor’s journey, drawdown can tell you several things about your strategy or portfolio. Here are a few of the most important insights:
- Risk: Drawdown can be a helpful gauge in measuring the risk associated with an investment or trading strategy. Bigger, lengthier, and more frequent drawdowns are all warning signs pointing to high risk.
- Strategy evaluation: There are several metrics that help assess a trading strategy’s performance and one of the popular ones is drawdown. Strategies that demonstrate smaller drawdowns are usually more stable and reliable.
- Recovery potential: While drawdown is mostly a metric for strategy or portfolio performance evaluation, we can also use it in assessing a trader’s performance. Clearly, more frequent drawdowns with higher magnitude are not a good sign, but the number of times the account has recovered from a drawdown is a great indication of how mentally resilient a trader is during losing streaks.
Drawdown vs. Standard Deviation
As already mentioned, drawdown measures the magnitude and quantity of losses associated with a trading strategy or portfolio. It shows the percentage difference between the peak value and lowest point of the strategy’s performance or account balance. Standard deviation, on the other hand, is a popular statistical metric that demonstrates the dispersion and volatility of a portfolio or strategy’s returns, compared to the mean or expected value. Note that while drawdown only focuses on the downside, standard deviation measures both positive and negative fluctuations in return.
What is the maximum drawdown (MDD) in trading?
Maximum drawdown, or MDD, is a more specific measure of drawdown. MDD is the magnitude of the biggest decline in value of an investment or trading account from its peak over a certain period of time. We use MDD to determine the maximum loss the investment has suffered before rising to a new high.
Traders and investor work in a ruthless, high-risk environment, the financial markets. Therefore, they should always plan for sub-optimal scenarios. Using maximum drawdown, which is a useful metric in measuring potential losses in the worst-case scenario, can be very beneficial. It provides an estimate of the largest drawdown you might suffer. So, you can make necessary adaptations to weather these tough periods.
How to Calculate?
To calculate the maximum drawdown, you can follow the steps below:
- Determine time period: The first step to MDD calculation is to determine a specific period of time to measure the maximum drawdown.
- Identify the peak: The next step is identifying the highest value the investment or trading account has seen during the given period.
- Find the low: Next, you should find the lowest point after the peak value.
- Calculate drawdown: Now you can subtract the lowest value from the peak value, divide it by the peak value again and show it in percentage terms. The result is maximum drawdown (MDD).
Maximum Drawdown Formula
The formula for calculating maximum drawdown is as follows:
MDD = (H – L) / H
H: Highest peak value in the given time period
L: Lowest point reached after the peak
The result is typically presented in percentage terms.
It would be beneficial to illustrate further with an example. Suppose that your trading account balance has reached the peak value of $10,000 in the last month. Following this peak, the balance subsequently dropped to $9,000 before recovering to make a new peak. In this case, MDD is calculated as follows:
MDD = ($10,000 – $9,000) / 10,000 = 10%
This indicates that your account has experienced a maximum drawdown of 10% during the last month, before recovering and reaching a new high.
How to Reduce Your Trading MDD
Drawdown can be very frustrating and every trader aspires to reduce their performance’s maximum drawdown.

Here, we present some tips for reducing MDD:
- Risk management: Arguably the most important aspect in trading, sound risk management can prevent suffering big drawdowns. By determining your position size based on different scenarios, optimizing reward to risk ratio, and using protective orders like stop losses, you can minimize the impacts of losses and reduce MDD.
- Diversification: By investing or taking positions in different asset classes with minimal correlation, you reduce your risk exposure and consequently, maximum drawdown.
- Adjusting for risk: Focus on risk-adjusted performance metrics rather than reaching maximum gains to reduce drawdown. Metrics like the Sharpe ratio measure the amount of risk taken to reach a certain amount of reward. Strategies with better risk-adjusted metrics are more suitable for maintaining consistent returns with minimal MDD.
- Backtesting: Backtesting refers to testing a specific trading strategy using past data, to determine how it would have performed back then. It can help you identify your strategy’s maximum drawdown and make adjustments to your strategy to address potential weaknesses and lower MDD.
- Psychology: Probably the most challenging part of a trader’s journey, maintaining emotional balance and discipline is essential for reducing maximum drawdown. An emotionally unstable individual can get trapped in a losing streak and would have a very hard time finding a way out.
Types of Drawdown in Trading: Analying Peak-to-Valley Losses
There are various types of drawdowns that traders and investors consider when analyzing their performance. Here are the most important ones:
- Maximum drawdown (MDD): As already explained, maximum drawdown measures the largest peak-to-valley decline in the value of a portfolio or trading account balance. MDD measures the maximum losses the trader has suffered during a given period.
- Average drawdown: Average drawdown is the average magnitude of drawdowns experienced during a specific period of time. It helps determine the average amount of losses a strategy demonstrates.
While there might be other metrics derived from drawdown, the two mentioned above are the most popular and useful ones. Both maximum drawdown and average drawdown can provide insight into a trader’s performance and assist in optimizing the trading strategy.
The Difference Between Trade Drawdown and Portfolio Drawdown
Depending on whether you are analyzing the performance of a trade or a portfolio, there are two different drawdown measures you should use. Trade drawdown measures the drop from the peak value to the lowest point in an individual trade. It is an important metric in active trade management, determining whether you are sticking to your risk management rules or not.
Portfolio drawdown, on the other hand, quantifies the overall decline in value of a certain portfolio of investments or positions. Contrary to trade drawdown, portfolio drawdown considers the impact of all open positions or investments on the value of the portfolio. This metric is useful when evaluating the performance and risk associated with a portfolio of investments.
The Causes of Drawdown in Crypto Trading
The causes of drawdown in crypto trading are quite similar to trading other asset classes, yet there are some small differences. Here is a list of reasons why you might experience drawdown:
- Volatility: The crypto market is a relatively small and young market. Being highly volatile, you might experience large drawdowns while trading crypto, especially if you fail to manage your risk properly.
- Weak risk management: Having flaws in your risk management can be detrimental to your trading performance. Failing to manage your risk might lead to massive drawdowns when adverse price movements occur.
- Poor Strategy: Having a poor-performing trading strategy or failing to clearly define trade entry criteria is another common reason for losses and drawdowns. Strategies should be based on strong technical and fundamental concepts in order to perform consistently.
- Liquidity issues: Trading some smaller cryptocurrencies might cause a significant drawdown. Many tokens are relatively illiquid compared to Bitcoin, Ethereum, and other market leaders and you might not be able to exit your trades where you prefer due to lack of liquidity. These issues can lead to considerable losses over time.
- Lack of discipline: Trading is a game of focus and discipline. In case you fail to follow your strategy’s predefined rules and stick to your risk management plan, you are highly susceptible to experiencing massive drawdowns.
What Is an Acceptable Drawdown in Trading?
The acceptable drawdown in trading depends on the trader’s personality and attributes. Traders with higher risk tolerance and patience might be able to go through longer losing streaks without losing control. Therefore, they would be able to weather more drawdowns. On the other hand, more conservative individuals typically have a lower acceptable drawdown. These preferences generally show themselves in the strategy the traders choose to work with.
However, we can use a general rule of thumb. The majority of traders feel uncomfortable when their equity drops below 80% of their initial balance. Furthermore, you will need to gain 25% to reach breakeven again if you are down 20%. So, while still being a considerable amount, 20% seems like an acceptable threshold.
The Importance of Trading Psychology for Managing Drawdowns
Having a reliable trading strategy and a solid risk management plan are both essential to a trader’s success in the long term. Yet, the most important element in trading is psychology. Trading psychology is the glue that keeps other parts of trading in place and assures consistency over the long run.

Emotional control is one of the key determining factors in a trader’s journey. For instance, if you fail to control your emotions after a string of losses, you are likely to revenge trade. Revenge trading is usually done by either increasing the amount you are willing to risk for an individual trade (over-leveraging) or taking more trades than usual (over-trading). Each of these issues can cause large drawdowns and with low control over yourself, you are highly unlikely to recover.
Trading also requires a huge deal of patience and discipline. Most professional traders have specific routines which they stick to, in order to stay disciplined. Discipline plays a vital role in following your strategy’s rules and being profitable consistently. Patience is also essential in trading, as you should wait for your entry criteria to execute your trades. You should also be very patient during drawdown periods, as impatience would likely lead to the over-leveraging or over-trading issues mentioned earlier.
How to determine system maximum drawdown (MDD) based on a backtest
Backtesting is highly beneficial to traders. By testing your strategy using past data, you are able to determine whether the strategy has been consistently profitable or not. Backtesting also helps you gather a considerable amount of data. You can use this data to measure different metrics related to your trading system and evaluate them. Backtesting plays an essential role in strategy optimization.
One of the key metrics you can extract from the data provided by backtesting is maximum drawdown. As previously explained, you must first identify the peak account balance during each period. The next step is to determine the following low point before recovery. Then, you should calculate the drawdown witnessed in every instance. Finally, the largest drawdown experienced would be the maximum drawdown. MDD is then presented in percentage terms.
How to Use Monte-Carlo Simulation to Better Understand Maximum Trading Drawdown (MDD)
Monte-Carlo simulation is a widely used computational method in Finance. Its main goal is to generate and analyze the possible returns of a specific trading strategy or portfolio, under different conditions. The Monte-Carlo simulation creates several distinct, random scenarios and estimates the returns. By repeating this process numerous times, you can calculate the probabilities associated with the occurrence of different outcomes. To use the Monte-Carlo simulation for MDD calculation, one should follow the steps below:
- Define inputs: You should define key parameters of your trading system, like winning ratio and average risk-reward.
- Generate random scenarios: The next step is to generate a large number of random scenarios with different inputs.
- Run the Monte-Carlo simulation: Apply your trading strategy to each distinct scenario and gather data.
- Calculate MDD: Using the generated data, you can calculate the maximum drawdown of your trading system.
- Analyze results: The results of the simulation can provide valuable insights into your strategy’s performance.
- Refine your strategy and repeat the simulation: In this step, you should make adjustments to improve your strategy’s performance. Run the Monte-Carlo simulation again and repeat the previous steps each time to optimize your trading system and reduce your MDD.
How to Manage MDD in Copy Trading?
Managing drawdown as a copy trader is almost the same as any other trader, and the aforementioned tips also apply here. Yet, here are some additional tips on how to manage your maximum drawdown effectively in copy trading:
- Choose a reliable copy trading platform: Selecting a reputable copy trading platform is essential. Solid copy trading platforms with no technical issues can help you manage your drawdown effectively, as you can focus on your job as a trader and not worry about operational problems.
- Set risk allocations and stop-losses: Always remember to determine suitable risk allocations and stop-losses for the trades you take. This allows you to protect your investors’ capital in case you are wrong.
- Analyze and evaluate your performance: The best copy trading platforms, like Finestel, offer various metrics for measuring the performance of your portfolio over time. Utilize these insights to optimize your trading strategy and boost your performance.
Infographic: A Visual Guide to Drawdown in Trading
Drawdown in trading Infographic
Conclusion
In this article, we introduced drawdown as one of the basic risk management concepts in trading. We have explained the drawdown in detail, analyzed the maximum drawdown (MDD), and demonstrated how it is calculated. Considering the importance of maximum drawdown, we then provided actionable tips to reduce it, whether you trade individually or as a copy trader. We also showed the benefits of backtesting and using Monte-Carlo simulation in optimizing your strategy and lowering MDD.
Drawdown can be the most frustrating part of a trader’s journey. Yet, it can provide you with valuable knowledge and experience. You can make adjustments and optimize your strategy by simply analyzing your past drawdown periods. Effective drawdown management can make your job as a trader more fruitful by minimizing the risk and maximizing the returns of your trading strategy.
FAQ
[wp-faq-schema]


Leave a Reply