News and Fundamental
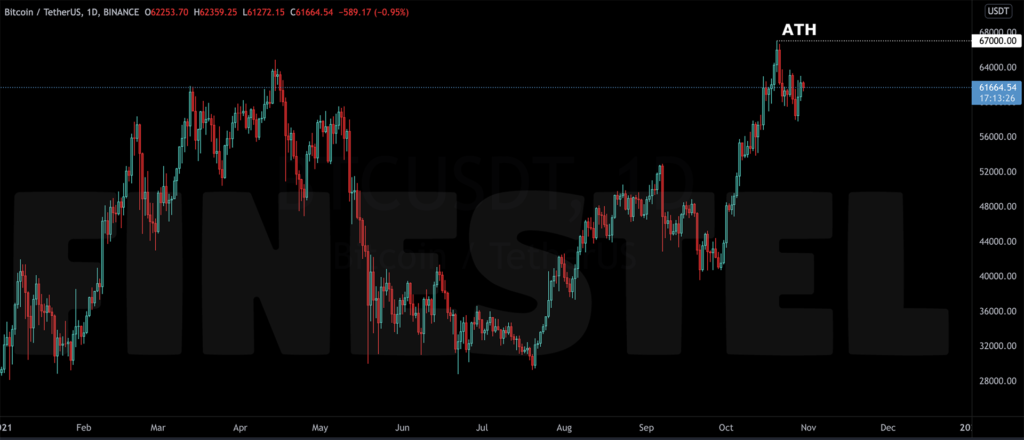
Since last week’s All-Time High, after Bitcoin touched $67K for the first time, the price has been gradually declining. We have had a calm week with both positive and negative news. First, a recent report claimed that about 3.1 million email addresses linking to CoinMarketCap users were leaked to the dark web and have been traded on “hacking forums,” which is a threat to users’ privacy.
Twitter and Square CEO Jack Dorsey has tweeted his prediction about inflation, and it has been viral on social media since then. He believes that hyperinflation is inevitable and will soon happen in the U.S. and the rest of the world, and it will change everything.
According to an SEC filing, the electric car company, Tesla, has confirmed that it may resume accepting Bitcoin as a payment option. As you may know, after Tesla announced that they would accept Bitcoin as a payment option for the first time, BTC’s price rose over 19% in a single day and started its rally to its prior ATH and reached $65K. But after China’s FUD in May 2021, Tesla stopped accepting Bitcoin as a payment, and it was one of the reasons which caused the famous crash.
Following the growing influence of stablecoins on the financial system, regulators across the world are racing to regulate the sector. Due to a recent report, the United States Securities and Exchange Commission may Steer Stablecoin Regulations and has geared up to propose legislation and supervise the $131 billion industry.
Tether Holdings Ltd., the issuer of the largest stablecoin by market cap, USDT, is set to combat money laundering by integrating payment security provider Notabene’s travel rule solution and is fully committed to transparency.
El Salvador, the country that made bitcoin legal tender alongside the U.S. dollar, has bought 420 BTC during the dip. They have purchased a total of 1,120 bitcoins, and the investment is already profitable.
Facebook goes all-in on Metaverse by announcing that it has changed its company name to Meta, as it showcases its vision for the future of social media, work, and play online. Following the announcement of the new name, the company said it would change its stock ticker from F.B. to MVRS, effective Dec. 1.
This change has driven the explosion of Metaverse projects’ coins/tokens.
Onchain Analysis
Open Interest’s RSI/Funding Rate update
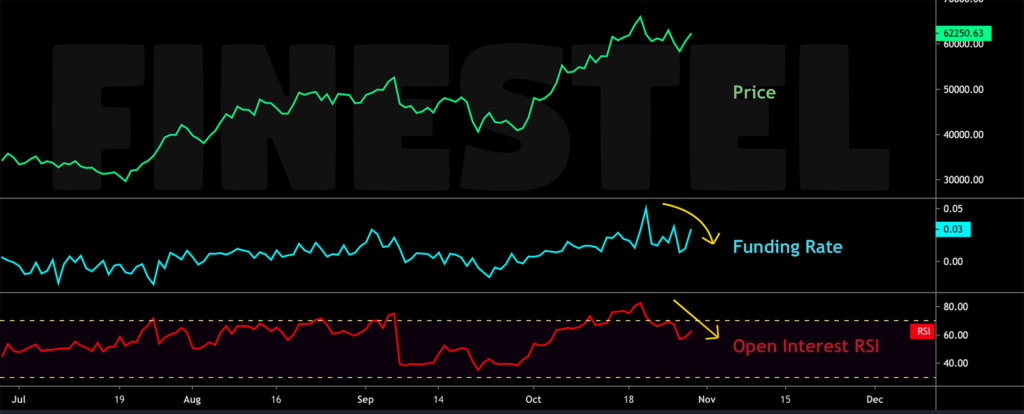
After Bitcoin reached a new all-time high, the price has been in a downtrend, and the Funding Rate has cooled down the same as the Open Interest. As it’s clear on the chart, the Open Interest’s RSI has been cooling down too and has reached the safe zone, which is below 70, indicating that lots of positions in the futures market have been closing or liquidating since the ATH. We can confirm this behavior by checking the Stablecoins Reserves on the exchanges.
All Exchanges Stablecoins Reserve
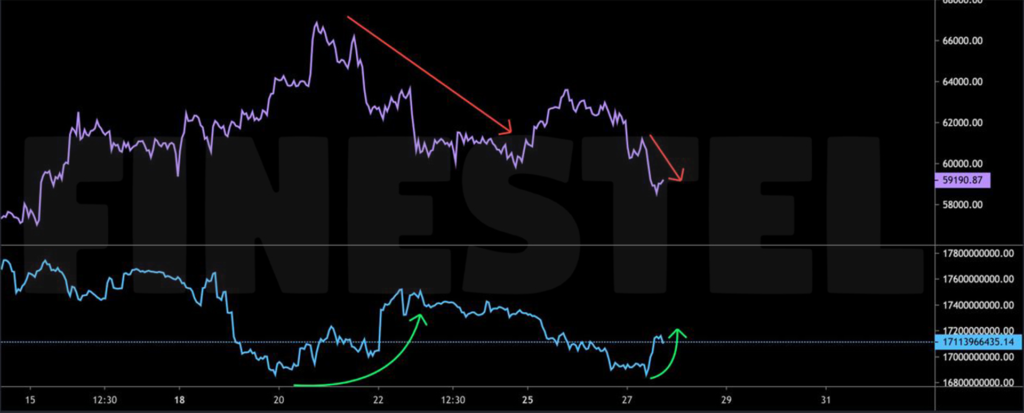
As mentioned before, we can see that stablecoins reserves on exchanges rose twice when the price was declining, indicating that these futures positions were closed and their profits were realized. We expect these stablecoins to soon get back to the market as a new demand and fuel the next bullish move.
All Exchanges To Derivatives Exchanges
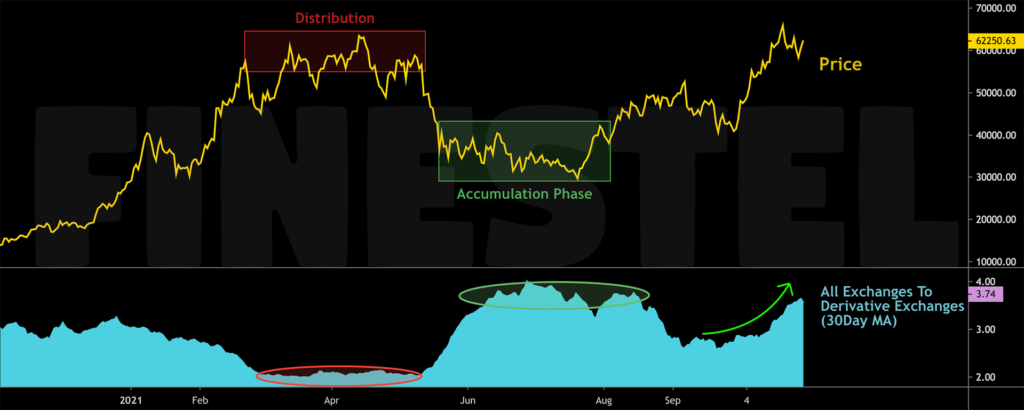
The chart above shows Bitcoin’s price compared to the 30Day MA of All Exchanges To Derivative Exchanges indicator. This indicator shows the amount of Bitcoin inflows from all exchanges to derivatives exchanges. The metric has always reached its lowest levels in the price tops, indicating a distribution phase in the market. An uptrend in this indicator shows that a greater amount of Bitcoin has been transferred into the derivatives exchanges to take long positions, which indicates more whale activity and is a bullish sign for the market.
The green area indicates the accumulation phase in which the price moves in a range and the metric starts to rise and reach greater levels. Historically, after the accumulation phase and a rise in the metric, we have experienced a great bullish move for the price in a long-term view. Now the indicator has reached its prior highs.
BCDD/Loss Percent
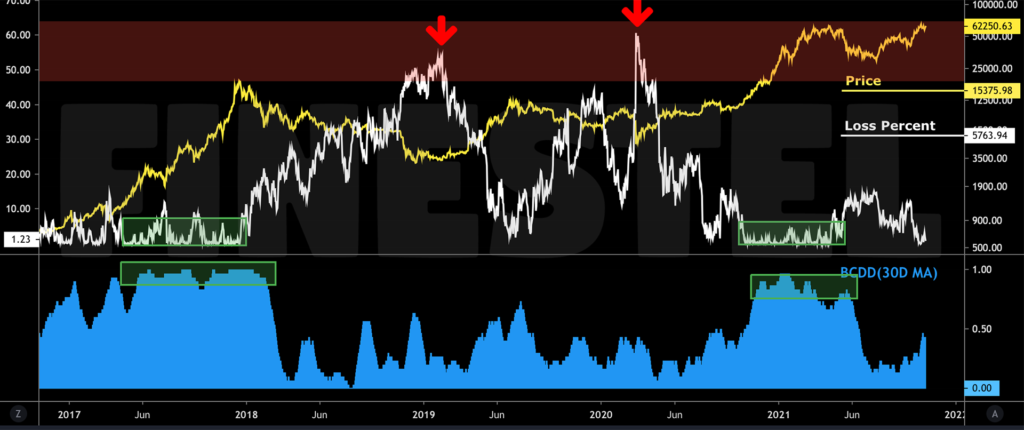
In this chart, we compared the price with the BCDD indicator and the Loss percent of the UTXOs. The white line shows the loss percent metric, which evaluates the number of UTXOs in loss by comparing the price between created and destroyed. The blue histogram is 30Day MA of the BCDD metric. This metric signals whether the current Supply-Adjusted CDD is larger than its average or not. But first, let’s see what the CDD metric is. CDD is the sum of products of spent transaction output alive days and its value which is an indicator that enables determining the sentiment amongst long-term-holders.
When BCDD(30D M.A.) reaches its tops(green area), we can conclude that the coins which have been spent that day are more from the long-term holders rather than the short-term, and if we take a look at the loss percent metric at the same time(green area), we can witness that the total amount of UTXOs which are being spent in loss, reaches to its lower levels. Because usually they’re smart players and won’t spend their coins in loss. This behavior usually can be seen in the bull market till the end of the cycle.
The exact behavior can be seen in bear markets till cycle lows when BCDD(30D M.A.) reaches its low levels, and loss percent reaches its high. This indicates that long-term holders, who are the smart players in the market, are accumulating bitcoin and aren’t spending their coins in loss. But the retailers who are scared of the market situation usually start spending their coins in loss during the bear market, which causes an uptrend in the loss percent metric.
Right now, the BCDD (30D M.A.) has started an uptrend which is a bullish sign for the market and indicates more long-term holders/whales’ activity.
Technical Analysis
Bitcoin (BTC)
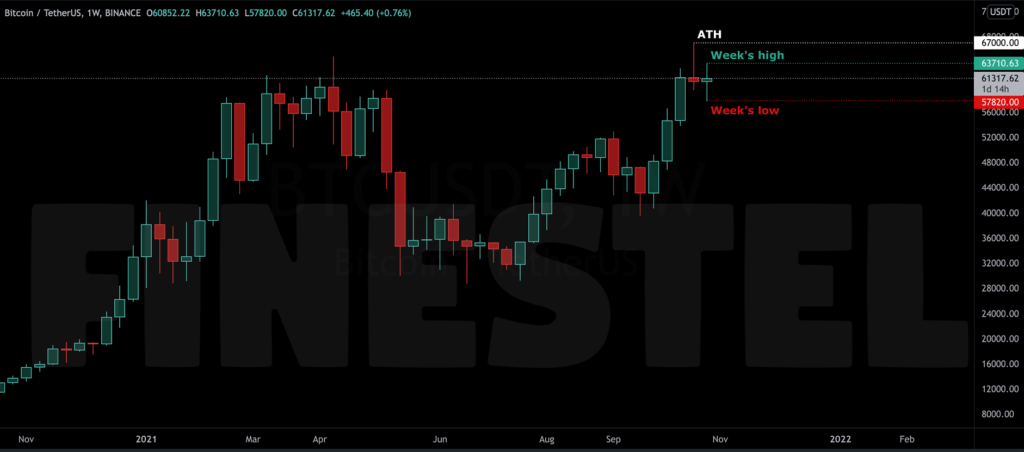
Since last week’s All-time high, after Bitcoin touched $67K for the first time, the price has been gradually declining. The week’s high is $63,710, and the week’s low is $57,820. Last week, after BTC reached a new ATH, the weekly candle closed in a Doji bar pattern, and the same happened this week.
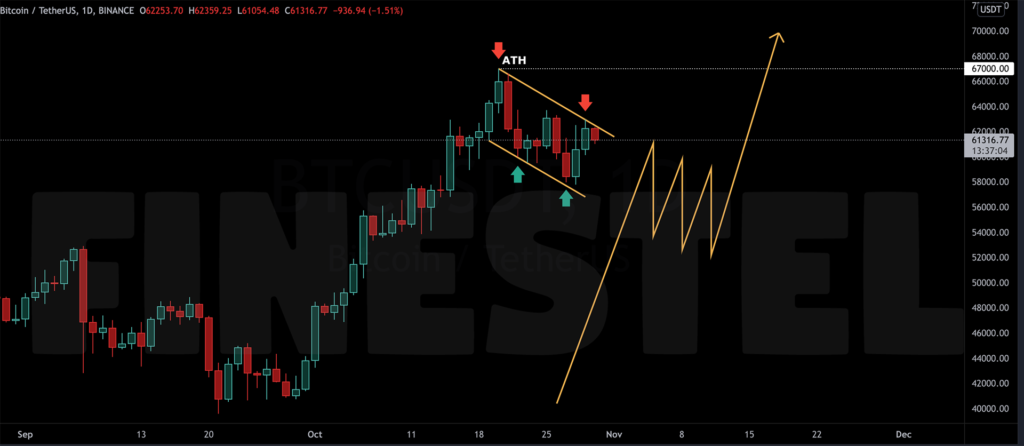
Based on price action analysis, we have to see a continuation correction pattern in the form of a bullish flag, wedge, triangle, etc., after an impulsive move as it’s drawn in the chart(yellow line). And now, if we take a look at the daily chart, we can see that the price is in a bullish flag continuation correction pattern.
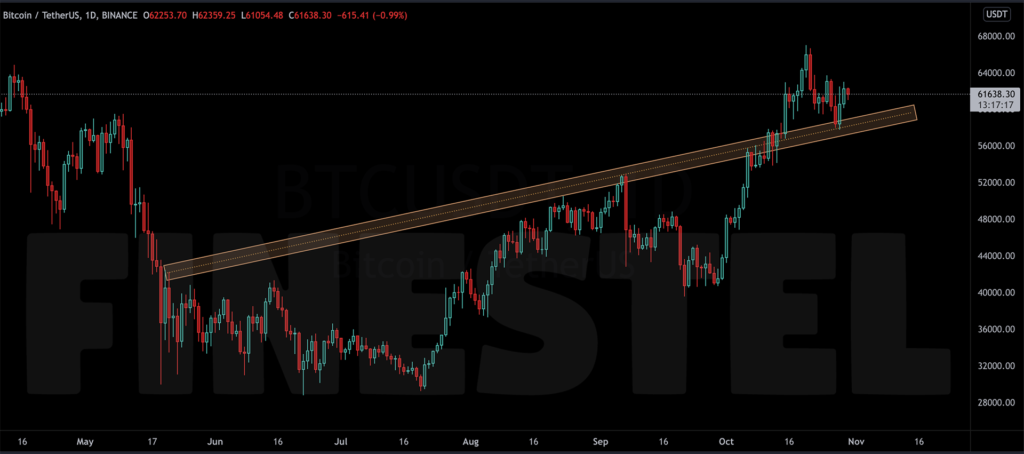
We can call the recent drop a pullback to the brown rectangle after the price broke it on Oct. 15. This confirms the correction pattern scenario mentioned before because pullbacks usually happen in the form of a correction pattern like here, where the price has been consolidating in a bullish flag.
Ethereum (ETH)
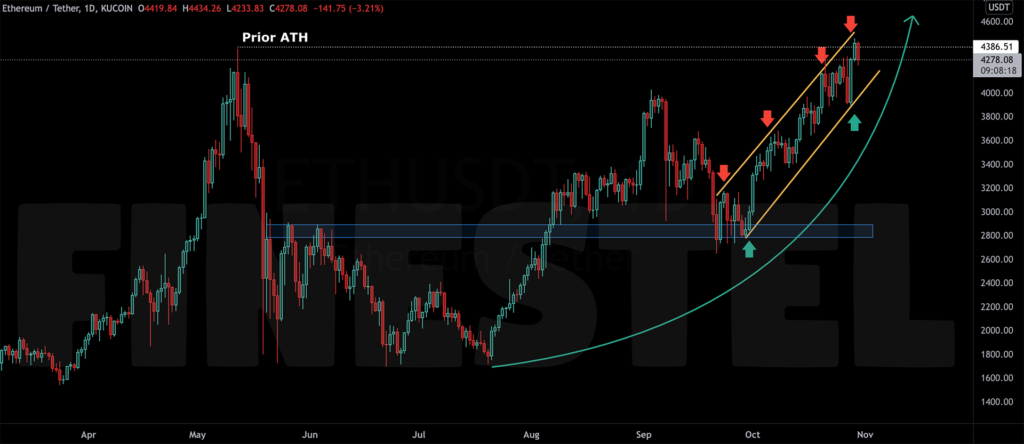
After two failed tries and Just nine days after the crypto community celebrated a new Bitcoin ATH, Ethereum has finally set a new record 171 days after the previous one by surpassing May 2021’s Peak and reaching $4405 for the first time. ETH has shown a great performance since the famous crash in May.
Right now, Ethereum is in an ascending channel with great momentum. ETH’s total market cap has surged above half a billion as it currently sits at around $511 billion.


Never seen such a thorough analysis on every aspect of the market!
what a great analysis!! Thanks to your great team.😍
That was pretty neat, thank you so much.