News & Fundamental
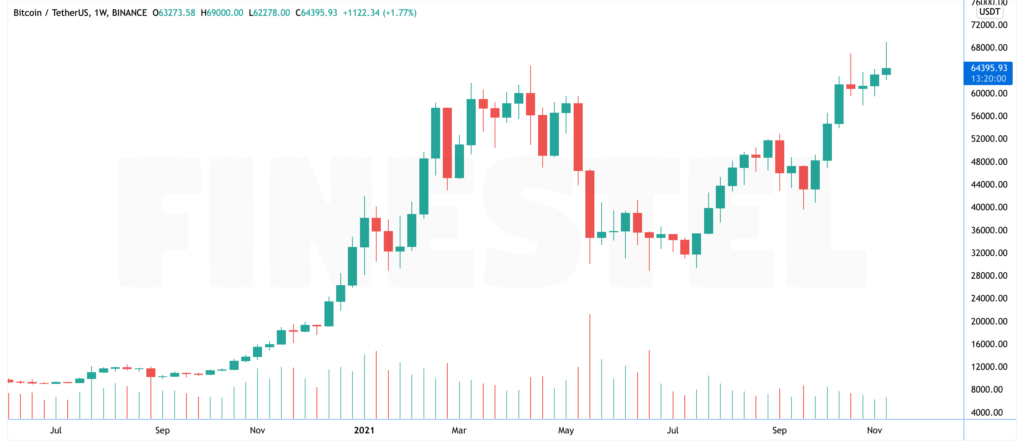
During the last week, Bitcoin price had experienced a strong bullish rally to a new ATH and reached $69,000, but this was followed by a $6000 shake out.
The United States House of Representatives passed the $1.2 trillion bipartisan infrastructure bill which, if signed into law by President Joe Biden, would enforce new provisions in relation to crypto-tax reporting for all citizens. This may be a bearish sign for crypto users in a short-term view.
With Bitcoin trading within 2% of its all-time high while Ethereum, Solana, and Polkadot push into previously uncharted price ranges, the Cryptocurrency market has reached a $3T combined market cap for the first time.
After several delays by the SEC, The United States Securities and Exchange Commission has officially disapproved asset manager VanEck’s spot Bitcoin exchange-traded fund. A spot ETF approval from the SEC, would be the most bullish news for the BTC but Investors will have to wait longer as the SEC rejected VanEck’s application.
After the United States president’s Working Group on Financial Markets proposed that Congress should regulate stablecoins like banks, USDC issuer Circle has declared support for the regulation and believes that a regulatory framework to guide stablecoin issuance, will affect the industry in terms of growth.
After AMC’s CEO, Adam Aron, first announced the entertainment giant’s plans to accept crypto payments by the end of the year, the theater chain has officially started to accept Crypto for payments on Nov 12.
Onchain Analysis
SOPR
This week we saw a great bullish move to a new ATH, but a rejection in the price afterwards. In this chart, we can speculate the driving force which led the price to a $6000 drop right after it had reached almost $70,000. As it is clear, we can see a jump in Short-Term holder SOPR indicating that the retailers and short term holders have realized some of their profits and sold their coins after the price had been rejected from the top. But we can’t say the same for long term holders as we can see that their profit taking trend has cooled off in the past days and LTH_SOPR experienced a drop.
Estimated Leverage Ratio
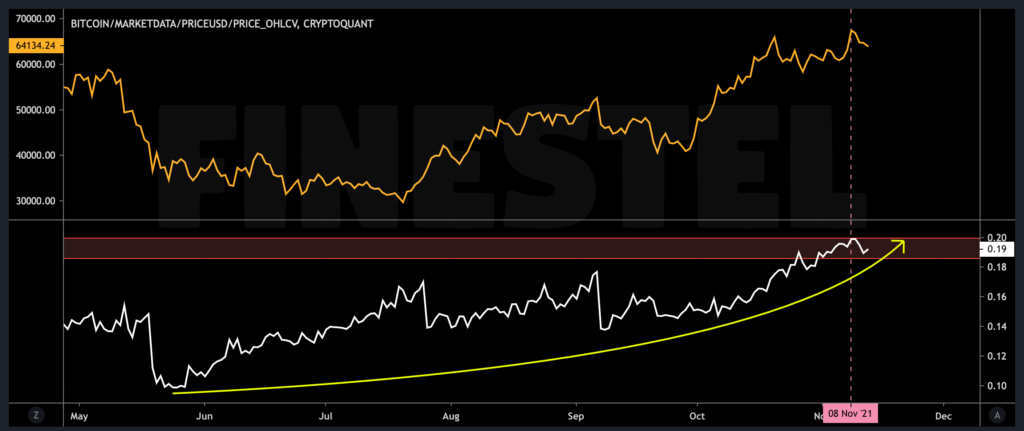
Since the major crash in May 2021, Estimated Leverage Ratio has been in an uptrend in general and we can observe high leveraged positions in the futures market. These positions can either get liquidated or closed due to the profit taking. Both happenings would affect the market in both ways. Right now, this metric has reached its highest levels which tells us that the futures market is heating up and we have to be careful. Looking for more validation, we can check the Open Interest and Funding Rate indicators.
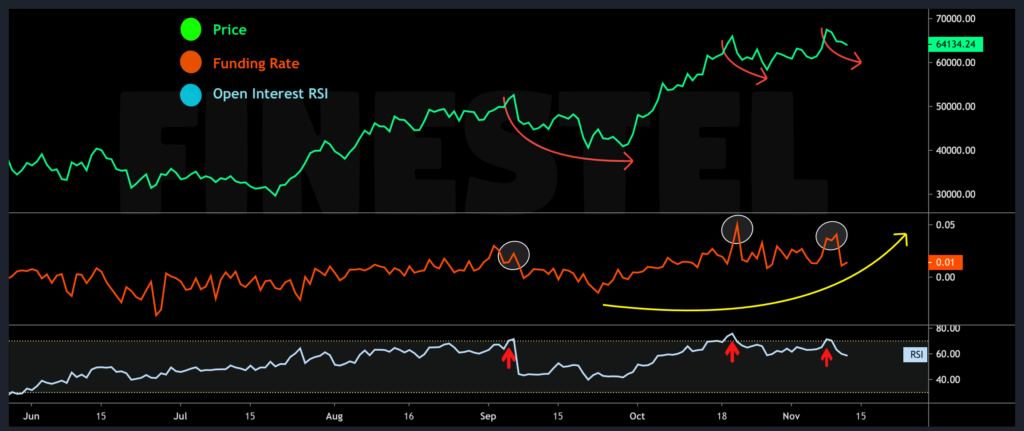
OI’s RSI/Funding Rate
Funding Rate has been positive since BTC started its rally from $40K zone aiming higher prices and new ATHs. During the recent leg up, the Funding rate jumped up the same as the Open Interest, which we can conclude from the RSI’s chart above (Blue Trend). Historically when Open Interest’s RSI went above 70, and Funding Rate was in an uptrend, we saw a top in the price. The same happened this week when the price reached $69K, there were lots of high leveraged open futures positions which, due to the Funding Rate, most of them were long positions. As a result, RSI had reached the danger zone and these positions either got liquidated or closed (realizing profit), hence, we saw a sharp $6K drop which left over $700 million worth of leveraged positions liquidated.
Coins Age Distribution
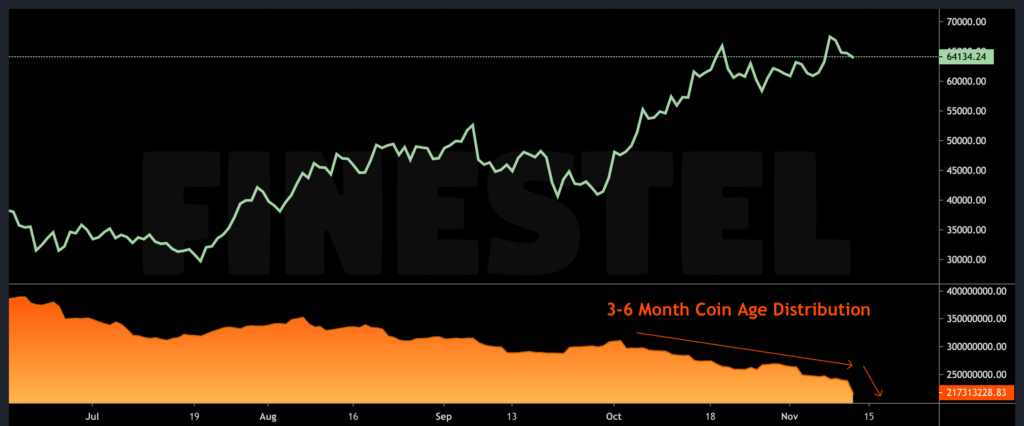
We can see the 3-6 month coin age distribution chart above. During the recent rally from $40,000 till now, the 3-6 month chart has been in a downtrend in general which indicates that 3-6 month holders have been using the market’s strength and realizing some profits. As it is clear, the metric has experienced a sharp drop recently after the price was rejected from the top.
Technical Analysis
Bitcoin
Daily chart
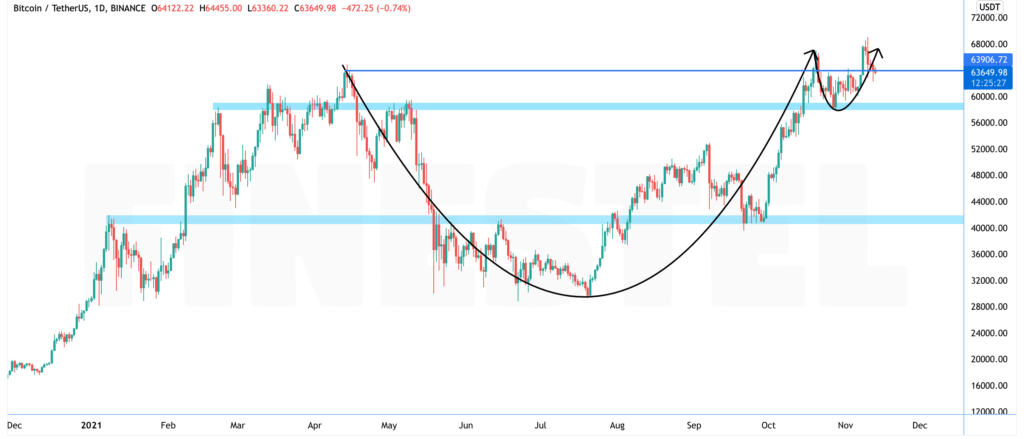
We had been on a great bullish leg up early this week until the price broke its prior ATH and reached $69,000. After that, it got rejected with a $6000 drop in the price which was largely driven by leverage long liquidations due to onchain metrics mentioned earlier.
It looks like the price is moving in the cup and handle pattern and the pattern looks complete with a near-term pullback to the previous resistance at $64.8K, which is now turned into support. As you know, pullbacks are essential for a healthy trend and we shouldn’t be concerned about the recent drop as it can be a short-term pullback to the prior high.
1 Hour Chart
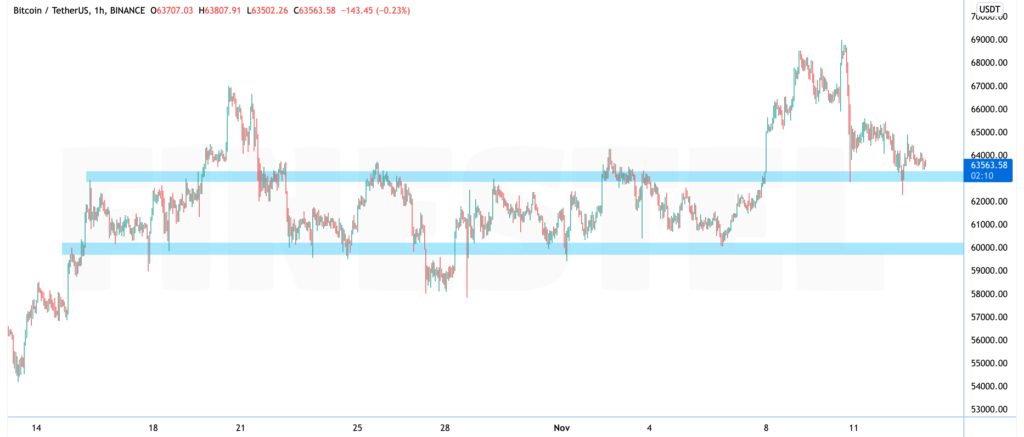
If we take a look into the 1 Hour chart, we can see that the Bitcoin support levels are at $63-64K and $60-61k and these support levels are getting stronger by price being above them. The general momentum especially in higher time frames is firmly bullish and we can expect another strong leg up in the long term view.
RSI
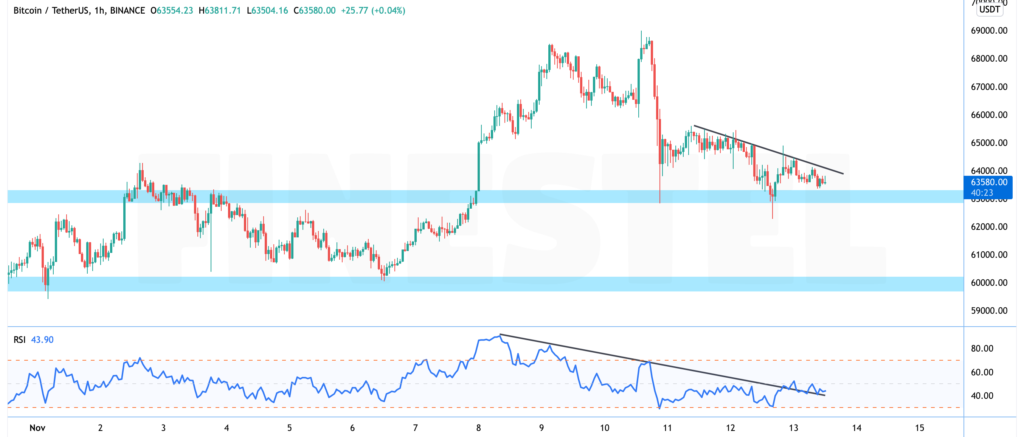 It is important that we see short-term corrections in a healthy bullish trend for the price. Right now, we can call the recent drop a pullback/correction in the main trend and we shouldn’t be worried. As you can see, the RSI trend had been the main resistance for the RSI until it broke it and formed a pullback in a continuation correction pattern.
Ethereum
Daily Chart
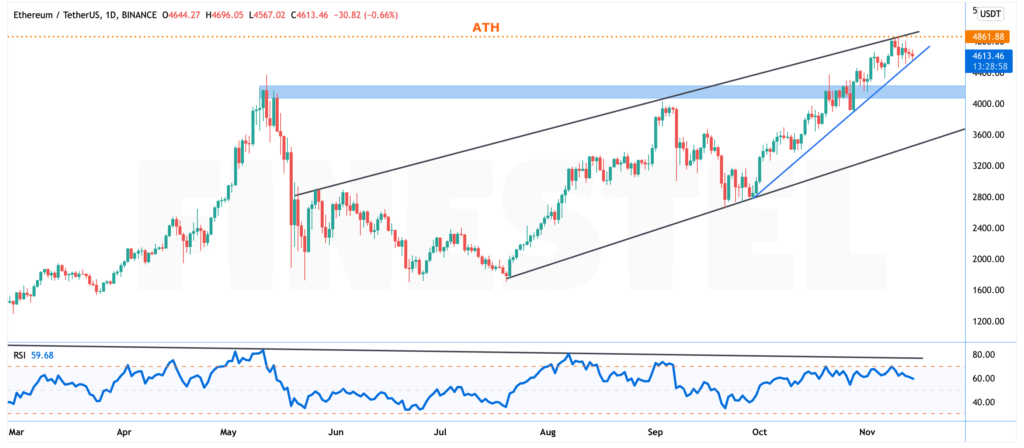
Ethereum, has been in an ascending bullish channel since after the major crash in May 2021 and has been registering new all-time highs recently. ETH reached $4868 on Nov 10th right after Bitcoin registered a new ATH at $69000. The major support for ETH is the $4200 zone in high time frames right now. The price has an ascending trendline as a support (blue line) in lower time frames which can hold the price in high levels.
4 Hour Chart
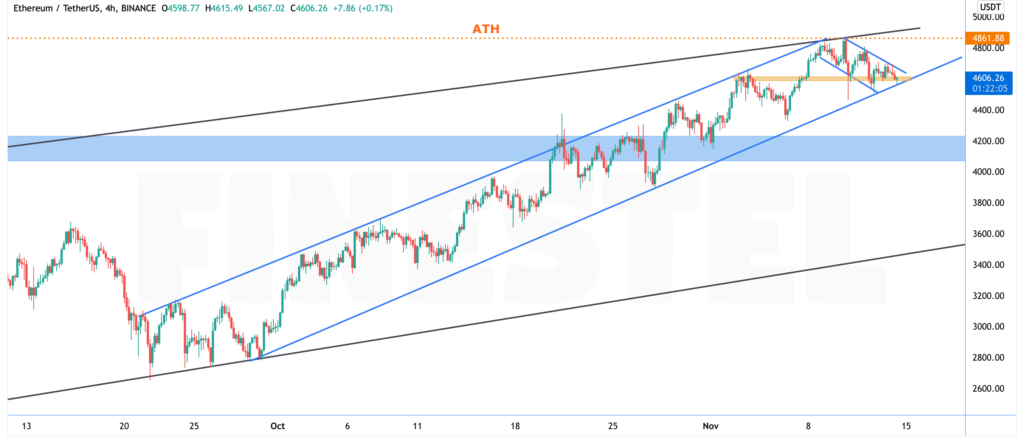
As it is clear at the 4H time frame, the price is in an ascending channel inside the black channel. Right now, the price is close to the bottom trendline of the channel and near the local support around $4600 so it may be supported from here. In terms of price action, the price is in a bullish continuation correction flag pattern and if it breaks it up, we can expect a new bullish rally.
1 Hour Chart
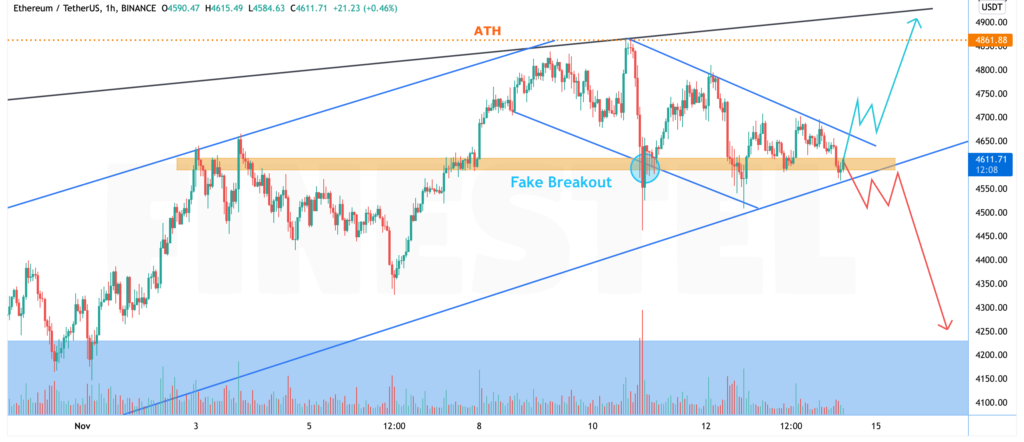
It is clear that the $4600 zone is a key support level in lower time frames as it has supported the price several times. Right now, the price is exactly at this level and we expect that it will be supported from here and we’ll see higher prices soon (blue path). But there is another scenario where the price breaks down the zone and drops to lower levels (red path).


Leave a Reply