In the world of trading and technical analysis, utilizing the right indicators can provide a critical edge. Meanwhile, TradingView has become one of the most popular platforms for traders. It offers numerous powerful indicators. You might be asking, “How many free TradingView indicators are there?.” Well, the answer is hundreds. Yet, there is a TradingView free indicators limit on each chart (the limit is based on your plan). Therefore, with countless TradingView free indicators, traders might have a dilemma in choosing the most capable one. This article focuses on presenting the best free indicators on TradingView in 2026.
These TradingView free indicators limit the need for extensive calculations. They deliver for both novice traders and seasoned pros looking to gain an extra analytical edge. We will provide a deep dive into some of the most accurate free TradingView indicators across different categories. These include trend indicators, oscillators, volume-based indicators, and a bunch of free algo indicators on TradingView. Whether you trade stocks, forex, crypto, or futures, these free indicators will take your technical analysis to the next level.

How to Get Free Indicators on TradingView?
As a trader new to trading or the TradingView platform, you might ask yourself, “How to get free indicators on TradingView”. Well, the process is simple. You should first head over to the charting tool. On the top toolbar, there is an Indicators button allows you to browse indicators. Clicking on the indicator you like, you will find out whether it is a free indicator or it is a paid one.
Being a web-based platform, you will not need to extensively search for phrases like “TradingView indicators free download” on Google to download indicators. Everything is offered on the platform itself.
Another frequently searched-for question is “How many indicators are free in TradingView?” While on TradingView, not all indicators are free, the majority of them actually are. And trust me, they will completely satisfy most of you.
The Moving Average Crossover
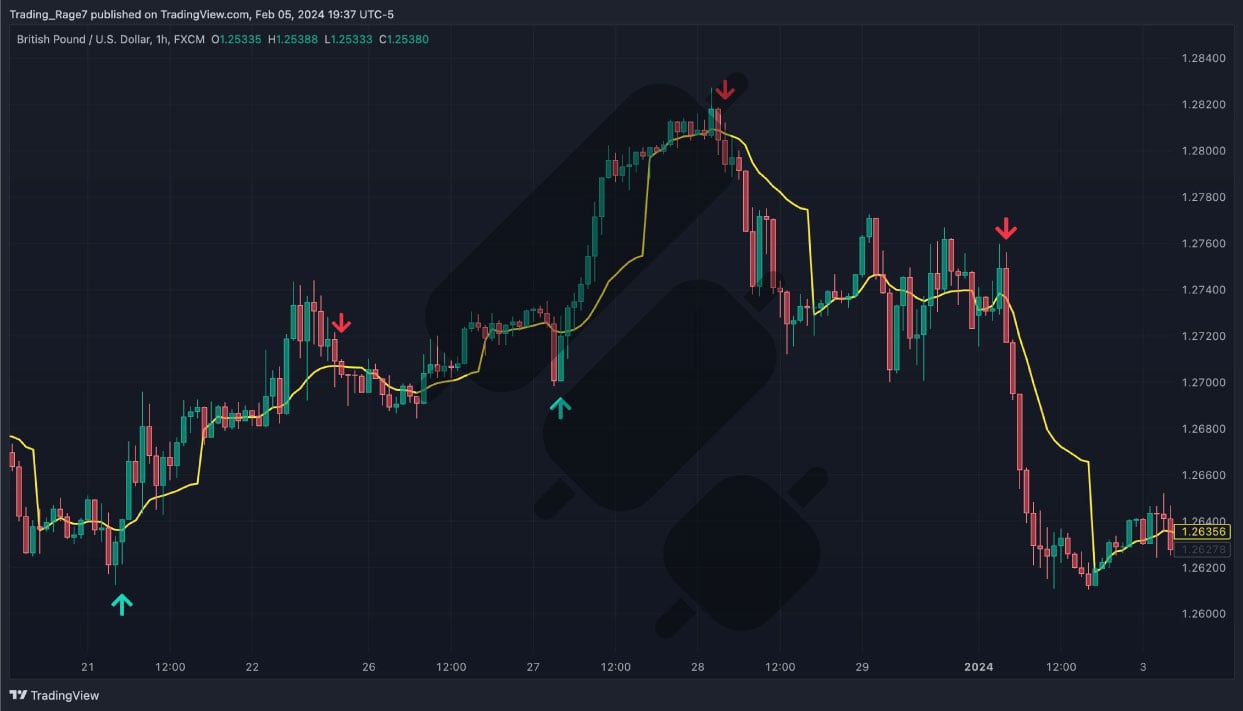
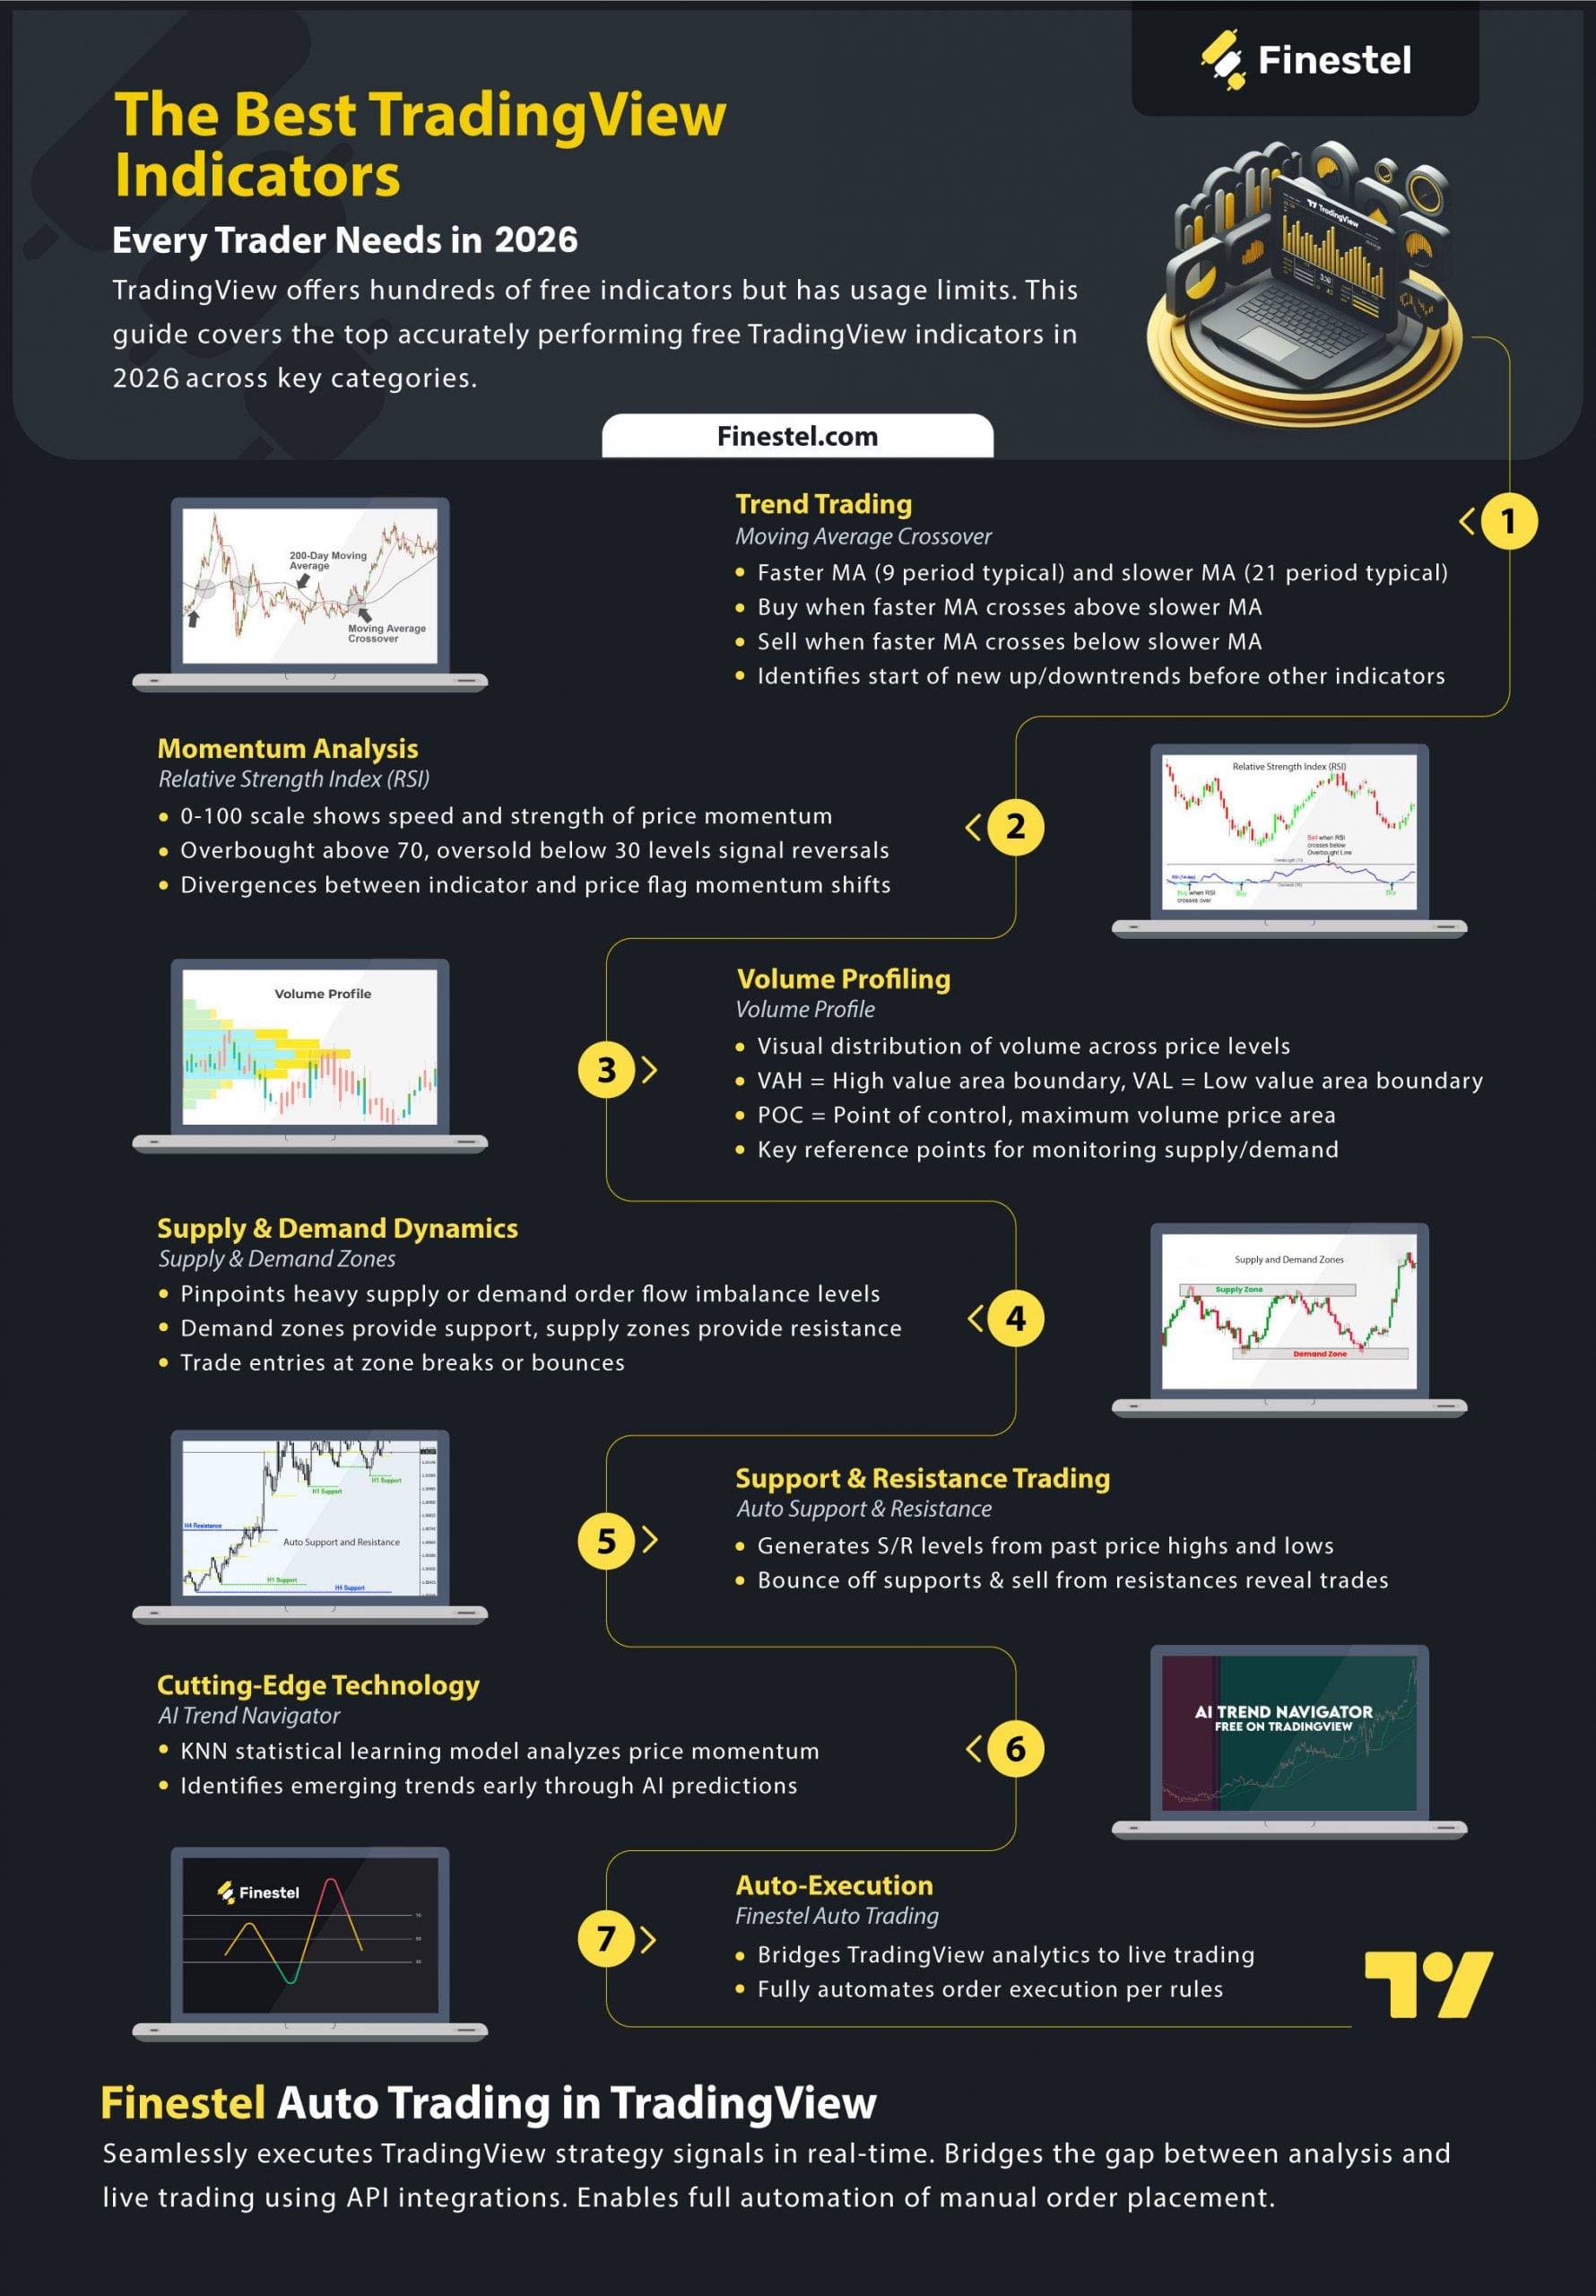
A widely utilized strategy that capitalizes on trend-following indicators is the moving average crossover. One of the best TradingView free indicators, the MA Cross, relies on two moving averages. These are typically the 9 and 21-period moving averages. The 9 MA is faster and more responsive to price changes, while the 21 MA moves more slowly.
As the image below demonstrates, when the 9 MA crosses above the 21 MA, it signals the beginning of an uptrend. Conversely, when the 9 MA crosses below the 21 MA, a downtrend emerges, and the indicator generates a sell signal. The crossover points identify trend changes sooner than other indicators. The MA cross is one of the most accurate free TradingView indicators.
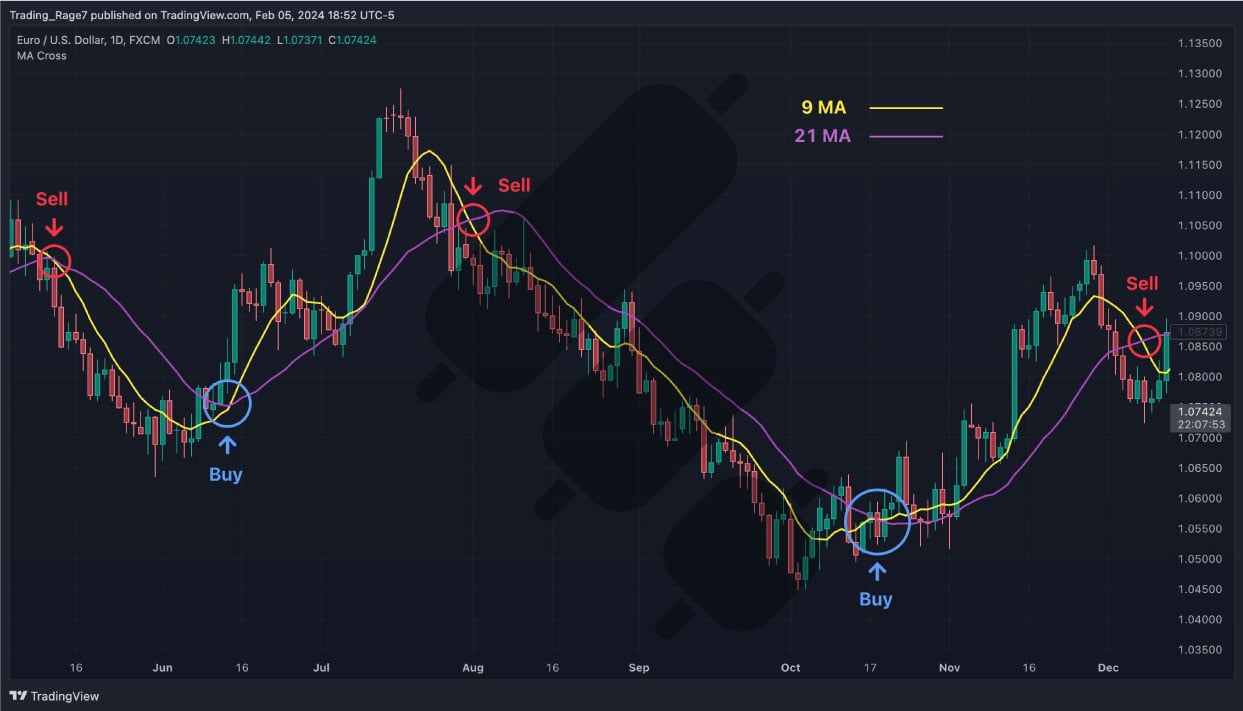
This simple yet powerful strategy allows traders to objectively identify and follow trends. Buying on 9/21 crossover buy signals and selling on sell signals aligns traders with momentum. Rather than subjectively predicting reversals, the moving average crossover system enters after trends emerge and exits when they show signs of fading. This mechanical approach minimizes emotion and discretionary decision-making.
While no indicator is perfect, the moving average crossover strategy offers an accessible method to capitalize on trends across various markets and timeframes. Used with proper risk management, it can boost consistency and profitability for trend-focused traders.
Relative Strength Index (RSI)
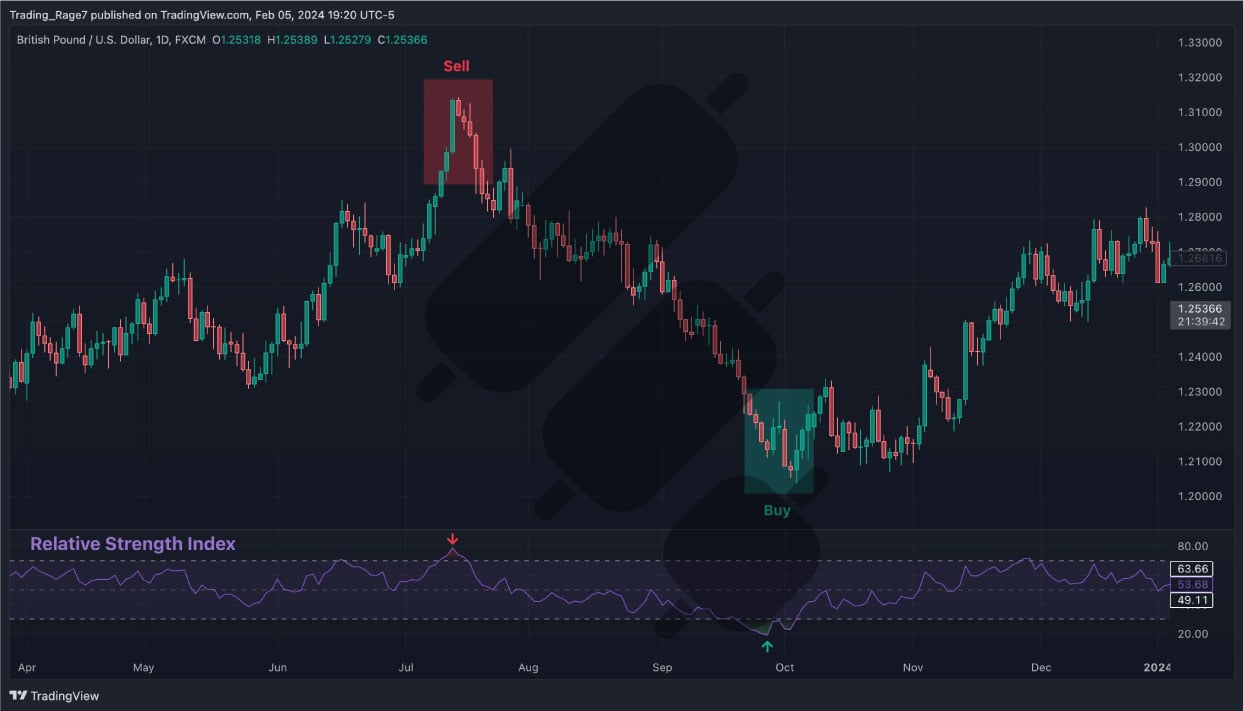
The Relative Strength Index, or RSI, is one of the best TradingView free indicators and has cemented itself among the most popular momentum oscillators. Developed by legendary technician Welles Wilder, RSI oscillates between 0 and 100 to gauge the speed and strength of price momentum.
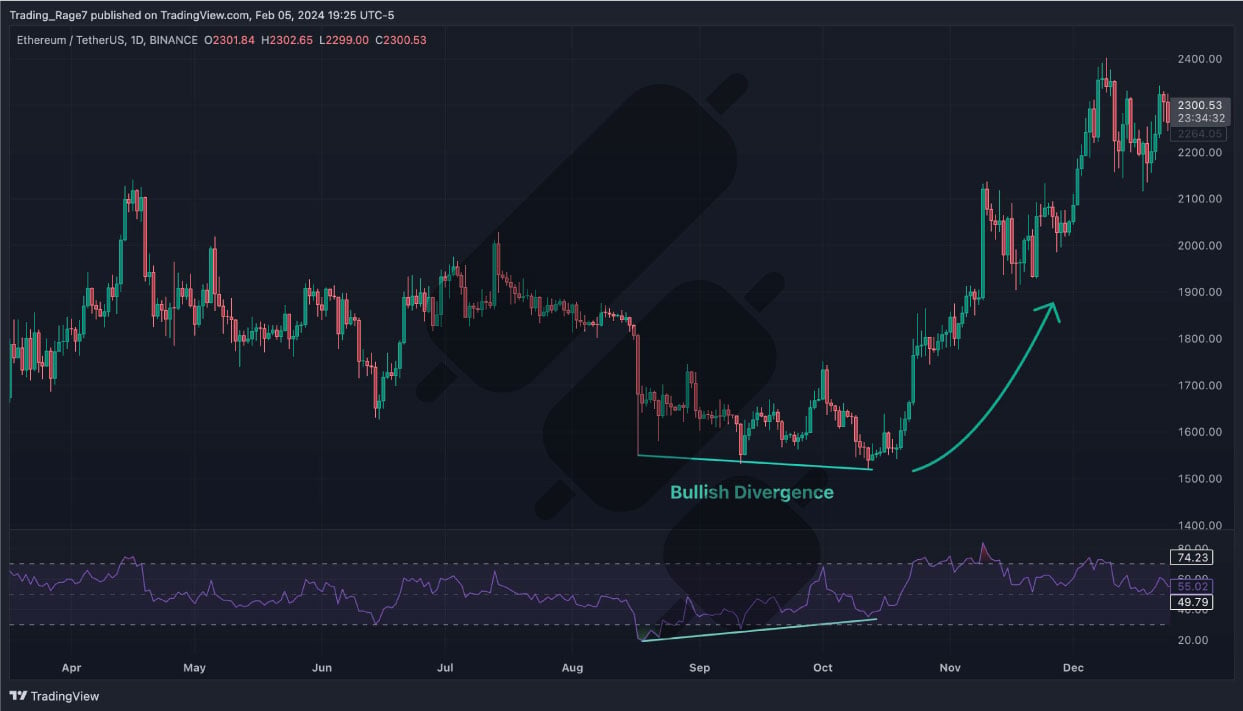
Readings above 70 indicate an overbought condition, while levels below 30 signal oversold. Savvy traders look to trade reversals when the RSI reaches these extreme highs or lows. As the RSI hits 70, an uptrend may exhaust itself as bullish momentum fades. The pullback from overbought presents selling opportunities.
Moreover, when the RSI nears 30, a downtrend could be overextending as bearish momentum wanes. The bounce from the oversold region provides buying chances.
Divergences between RSI and price reveal shifts in momentum ahead of the curve. Bullish divergence forms when the price makes a lower low while the RSI carves a higher low. This shows upside momentum is building despite price weakness. A bearish divergence occurs when the price posts a higher high, but the RSI forms a lower high, signaling fading momentum that could precede a top.
RSI’s unique ability to evaluate momentum, overextensions, and divergences makes it indispensable for technicians. Combining RSI with prudent risk management allows traders to capitalize on high-probability reversals and trend continuations across all timeframes. RSI stands the test of time as a leading indicator for timing entries and exits. However, note that using the RSI alone is unlikely to provide profitable results. Therefore, try to merge the RSI with other technical analysis tools for better performance.
Read about TradingView premium account; is it worth it?
Volume Weighted Average Price (VWAP)
The Volume Weighted Average Price (VWAP) is among the most useful free indicators. This dynamic indicator tracks the average price weighted by volume over a specified timeframe. VWAP reflects the cumulative money flow in a stock or asset, making it a useful tool for gauging fair value.
Intraday traders utilize VWAP to identify and trade around key intraday levels. As the price rises above VWAP, it indicates bullish momentum, signaling potential long entries. When the price drops below VWAP, it reflects building bearish momentum for possible short setups.
VWAP also marks key support and resistance for intraday trading. Bounces and breaks of VWAP can generate profits. Aggressive traders look to fade the VWAP cross and trade the reversion back toward it. Using multiple timeframes provides additional reference points.
With its dynamic relation to volume, VWAP delivers valuable insight into emerging momentum and sentiment shifts. VWAP strategies provide objective criteria for executing intraday trades and planning daily trend trades across markets.
Learn how to reduce crypto trading fees with a few simple steps.
Free Volume Profile Indicator
Volume profile is an advanced charting technique. The best free volume profile indicator TradingView offers provides a visual depiction of volume data over specified time periods. It dissects price action into visual bars that show the volume traded at each price level. Volume profile illuminates key support and resistance levels known as VAL, VAH, and POC.
The area where the majority of the volume is traded is called the value area. The VAL (Value Area Low) indicates the lower level of the value area. On the other hand, the VAH (Value Area High) marks the higher boundary of the value area.
The POC (Point of Control) is the price level with the maximum volume over the full range. It highlights the key price attracting the most interest from market participants. The POC serves as pivotal support and resistance.
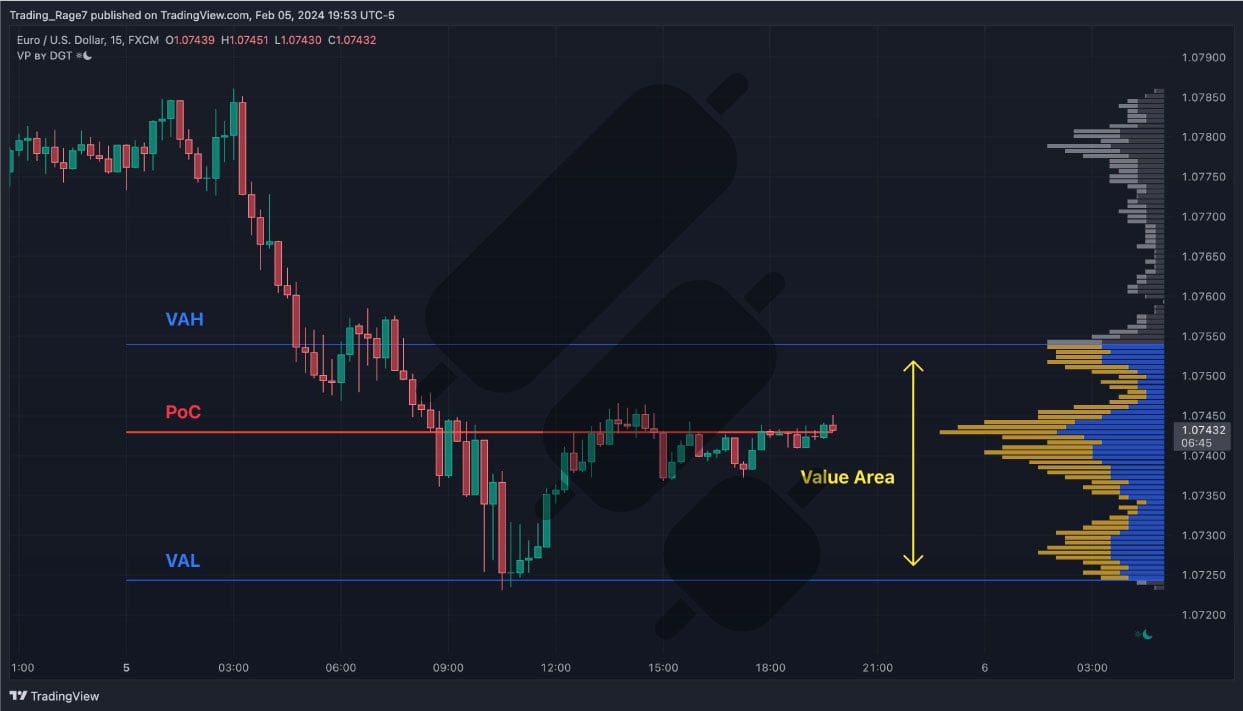
VAL, VAH, and POC all act as reference points for the next day. For instance, savvy traders look to buy at or just above the VAL support and sell at or below the VAH resistance. Shifts in the POC can alert traders to changing market conditions.
As the best free volume profile indicator on TradingView, this indicator delivers a multidimensional perspective on price action. Locating influential volume zones with VAL, VAH, and POC allows traders to precisely time entries and exits. As the best free volume profile indicator TradingView offers, it is a significantly beneficial tool for determining high probability support and resistance levels.
Traders who leverage this powerful, free volume profile indicator on TradingView, will gain a significant analytical edge. Therefore, is one of the best free volume profile indicators TradingView presents for unlocking opportunities.
Free Supply and Demand Indicator on Tradingview
Supply and demand form the backbone of technical analysis. At an elementary level, uptrends are driven by surging demand that overwhelms supply. Downtrends take hold when swelling supply exceeds demand. The sweet spot for traders is locating imbalances between supply and demand ahead of the curve.
With the free supply and demand indicator TradingView equips you with, you can visually identify the key supply and demand zones on the chart over a specified timeframe. These zones highlight the precise price areas where supply or demand is strongest.
The free supply and demand indicator on TradingView marks demand zones where buying interest overwhelms sellers, pushing the price higher. It also identifies supply zones where selling pressure was strongest, driving the price lower. These act as support and resistance areas to watch on pullbacks.
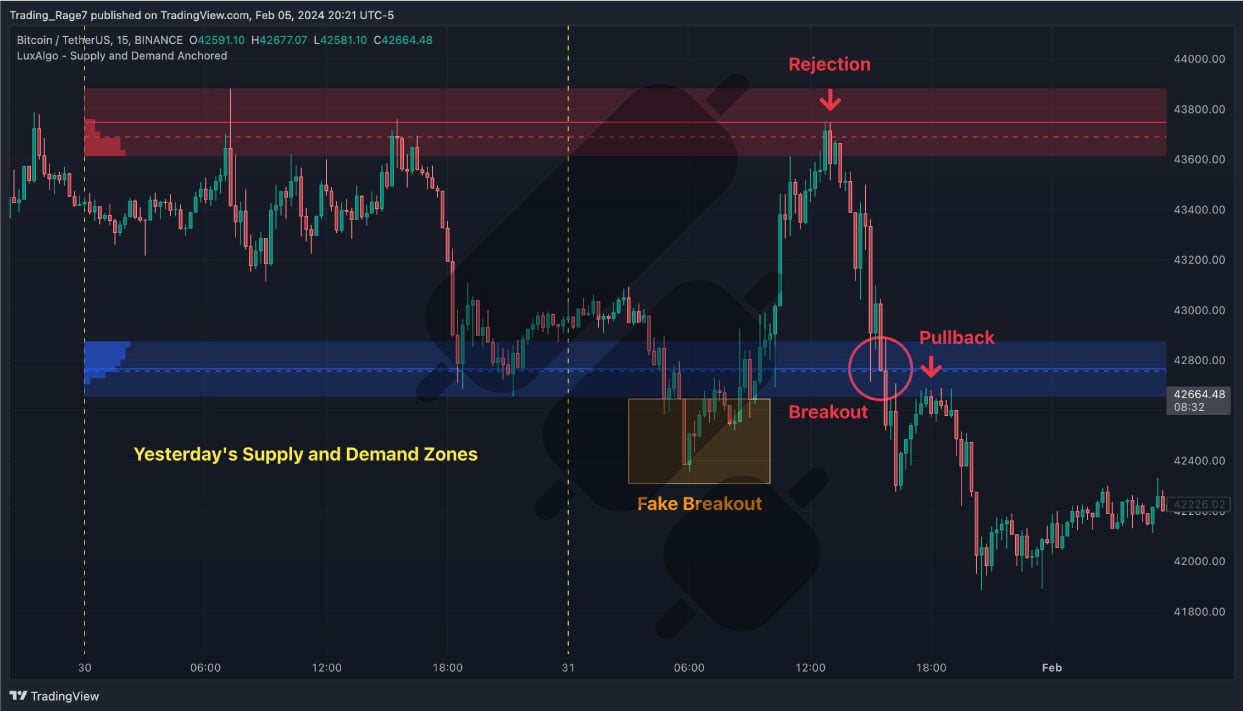
Savvy technicians utilize the prominent supply and demand zones from previous days or weeks as trade entry targets. The demand zones serve as bullish support levels to buy into. The supply zones act as bearish resistance areas to sell or short at.
This tool is arguably the most accurate free TradingView indicator in the supply and demand category. Trading off the supply and demand imbalance points spotted early by the free supply and demand indicator on TradingView can be a profitable strategy. By objectively locating high-probability support and resistance with confirmed order flow, traders gain an advantageous entry filter for their technical system.
Best Free Support and Resistance Indicator on TradingView
Identifying key support and resistance levels is an essential component of technical analysis. This is where the free support and resistance indicator TradingView offers comes into play. This indicator pinpoints potential support and resistance zones on the chart based on previous price action and structure.
It uses formulas and past highs and lows to calculate significant support and resistance levels. Then, the free support and resistance indicator on TradingView plots horizontal lines on the chart at these levels. This is one of the most accurate free indicators for support and resistance trading.
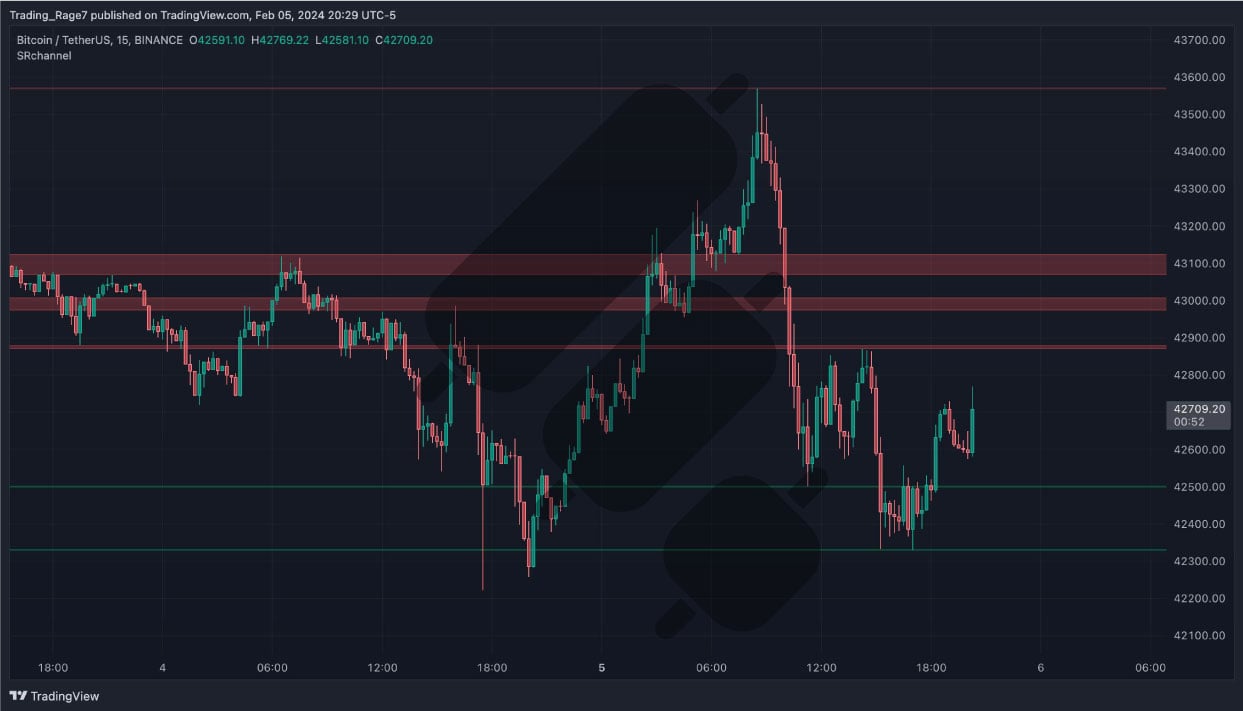
When the price approaches the support lines, traders watch for bullish reversals or bounces. These become opportune long entry points. As price nears resistance lines, traders anticipate bearish reversals and look for shorting opportunities.
The free support and resistance indicator offers an extremely beneficial tool. Trading the bounces and breaks of support and resistance illuminated early is a popular strategy among traders.
TradingView Free Buy Sell Indicator
The TradingView free buy sell indicator refers to the powerful combination of the Parabolic SAR, EMA 200, and MACD Signals available for free on TradingView. This fusion indicator provides traders with clear buy and sell signals to optimize entries and exits.
The TradingView free buy sell indicator leverages the trend identification capacities of Parabolic SAR, the dynamic support/resistance of EMA 200, and the momentum analysis of MACD. This creates an indicator that comprehensively evaluates market conditions to generate high-probability trade signals.
When the price is above EMA 200, Parabolic SAR trends up, and MACD is positive, the TradingView free buy sell indicator prints a buy signal. Conversely, with price below EMA 200, Parabolic SAR trending down, and negative MACD, the TradingView free buy sell indicator produces a sell signal.
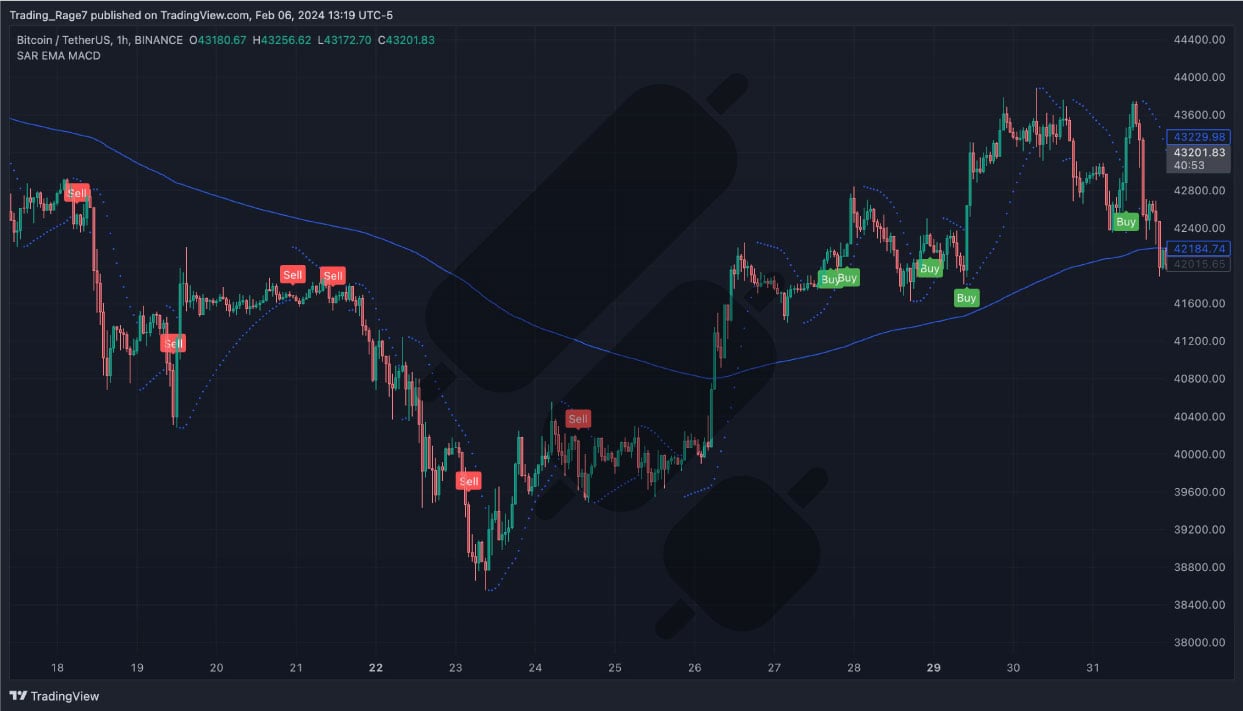
By combining these carefully selected technical analysis tools, the TradingView free buy sell indicator empowers traders to make decisions backed by multiple confluences. Using this TradingView free buy sell indicator alongside risk management strategies can significantly boost trading performance.
Overall, being one of the most accurate free TradingView indicators, this tool exemplifies how combining different indicators creates a reliable system for identifying optimal market entry and exit points.
AI Trend Navigator: The Best Free AI Indicator on Tradingview
As markets evolve in complexity, so too must the trader’s toolkit continue advancing. Cutting-edge indicators like the free AI indicator, offers represent the next generation of TradingView trading technology. Developed to identify emerging trends early using artificial intelligence, it provides a potential edge to technical traders.
The free AI indicator TradingView provides is powered by two key components – the KNN Moving Average and the KNN Classifier. The KNN Moving Average analyzes recent price action to calculate the trend’s direction. It filters out noise by focusing on the closest price values. The KNN Classifier then leverages machine learning to categorize the price action and predict the highest probability future direction.
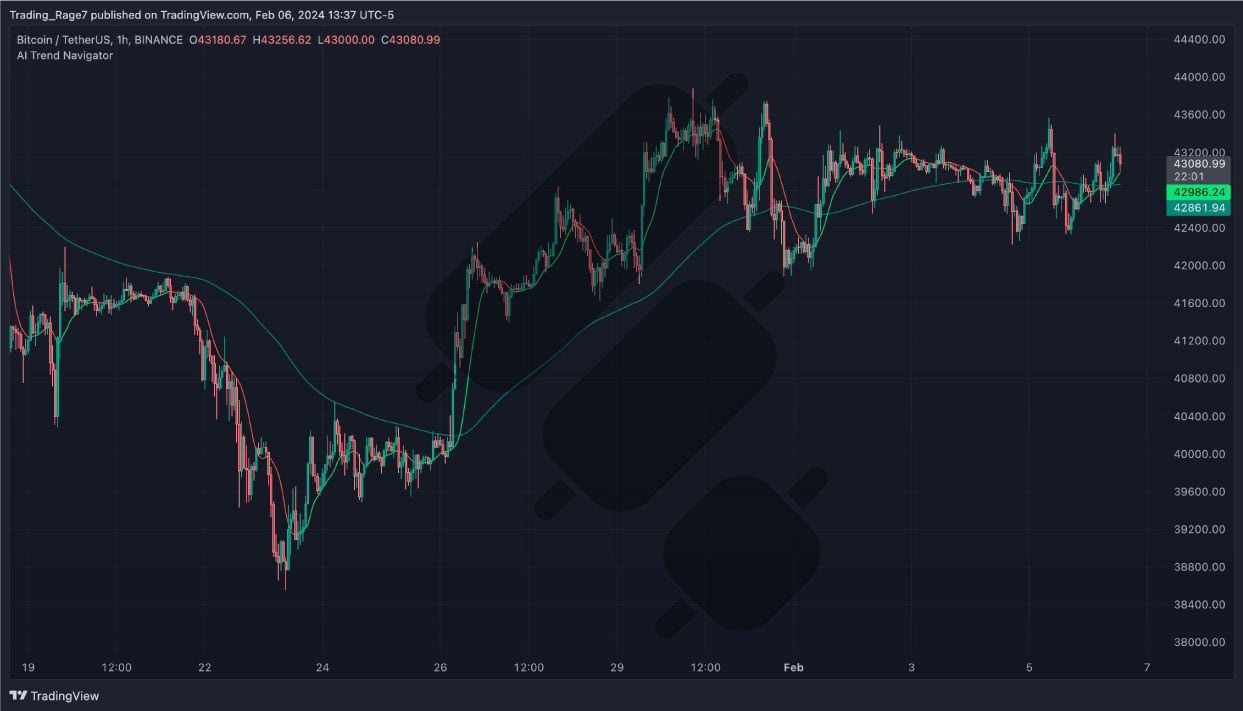
With this fusion of AI and technical analysis, traders gain an additional edge. They can ride trends with greater confidence as the free AI indicator on TradingView provides objective confirmations. The KNN Classifier also flags potential reversals or changing trends ahead of time through its predictive capabilities.
The free AI indicator TradingView offers, the AI trend navigator, demonstrates how integrating artificial intelligence can push trading technology forward. This free AI indicator on TradingView combines data science and quant trading to uncover opportunities.
Traders who leverage this free AI indicator will gain a decisive analytical advantage in these evolving markets. Advanced indicators like this free AI indicator on TradingView represent the future of intelligent analytics.
Lux Algo Free Elliott Wave Indicator on TradingView
The Elliott Wave indicator provides technicians with a tool to automate Elliott Wave analysis. This free Elliott wave indicator TradingView offers allows traders to capitalize on its principles. By automatically detecting impulse and corrective waves in real time, it delivers an objective perspective on wave counts.
The free Elliott wave indicator uses pivot points and Fibonacci calculations to identify the five impulse waves and three corrective waves. It plots each wave segment on the chart as it forms according to the structure Elliott Wave theory entails.
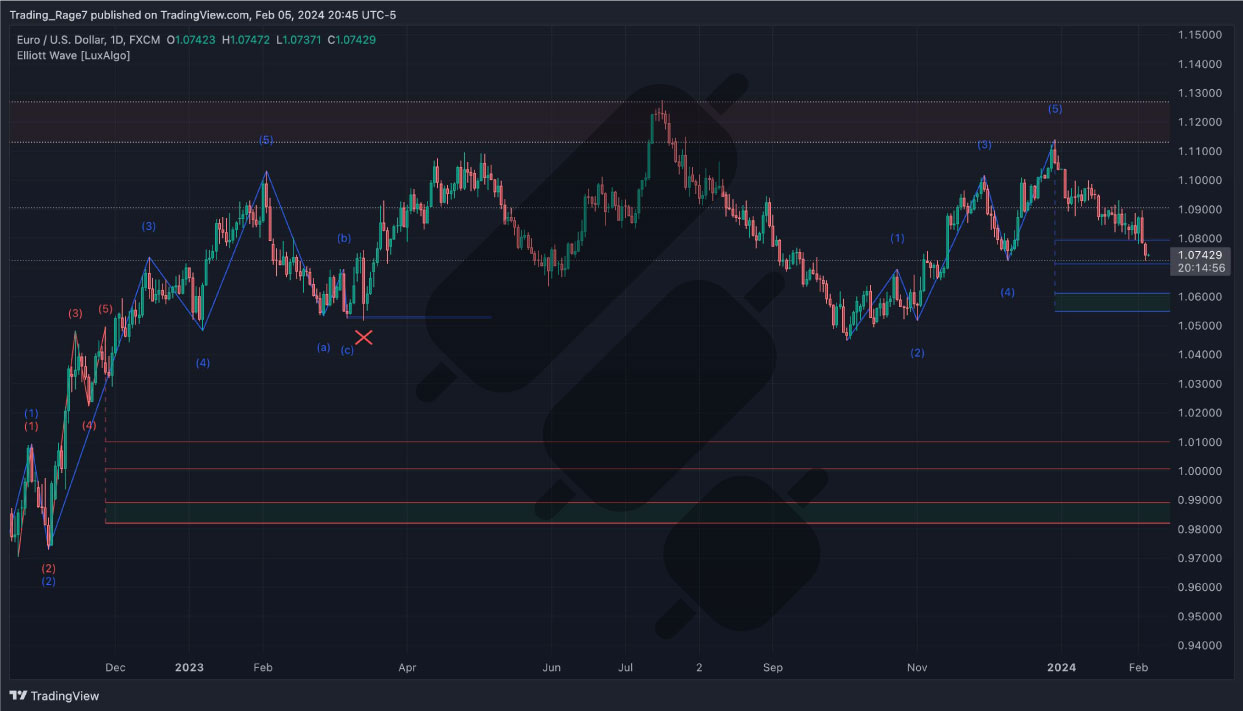
With the evolving wave count visually displayed, traders can anticipate high-probability reversal points to target trades. Key Fibonacci ratios between waves offer ideal entry and exit levels. Wave relationships demonstrated by this free Elliott wave indicator TradingView offers, also provide clues on the market’s position within the broader trend.
As one of the most widely followed analytical approaches, integrating the Elliott Wave theory into a trading system generates an advantage. The free Elliott wave indicator on TradingView objectively applies this method, removing subjectivity and the need for manual wave counts. By distilling the Elliott Wave into an automated tool, traders gain precision in pinpointing turning points as waves complete. So, this might just be one of the best free indicators on TradingView.
Finestel’s Autotrading on TradingView: Make Everything Mechanical
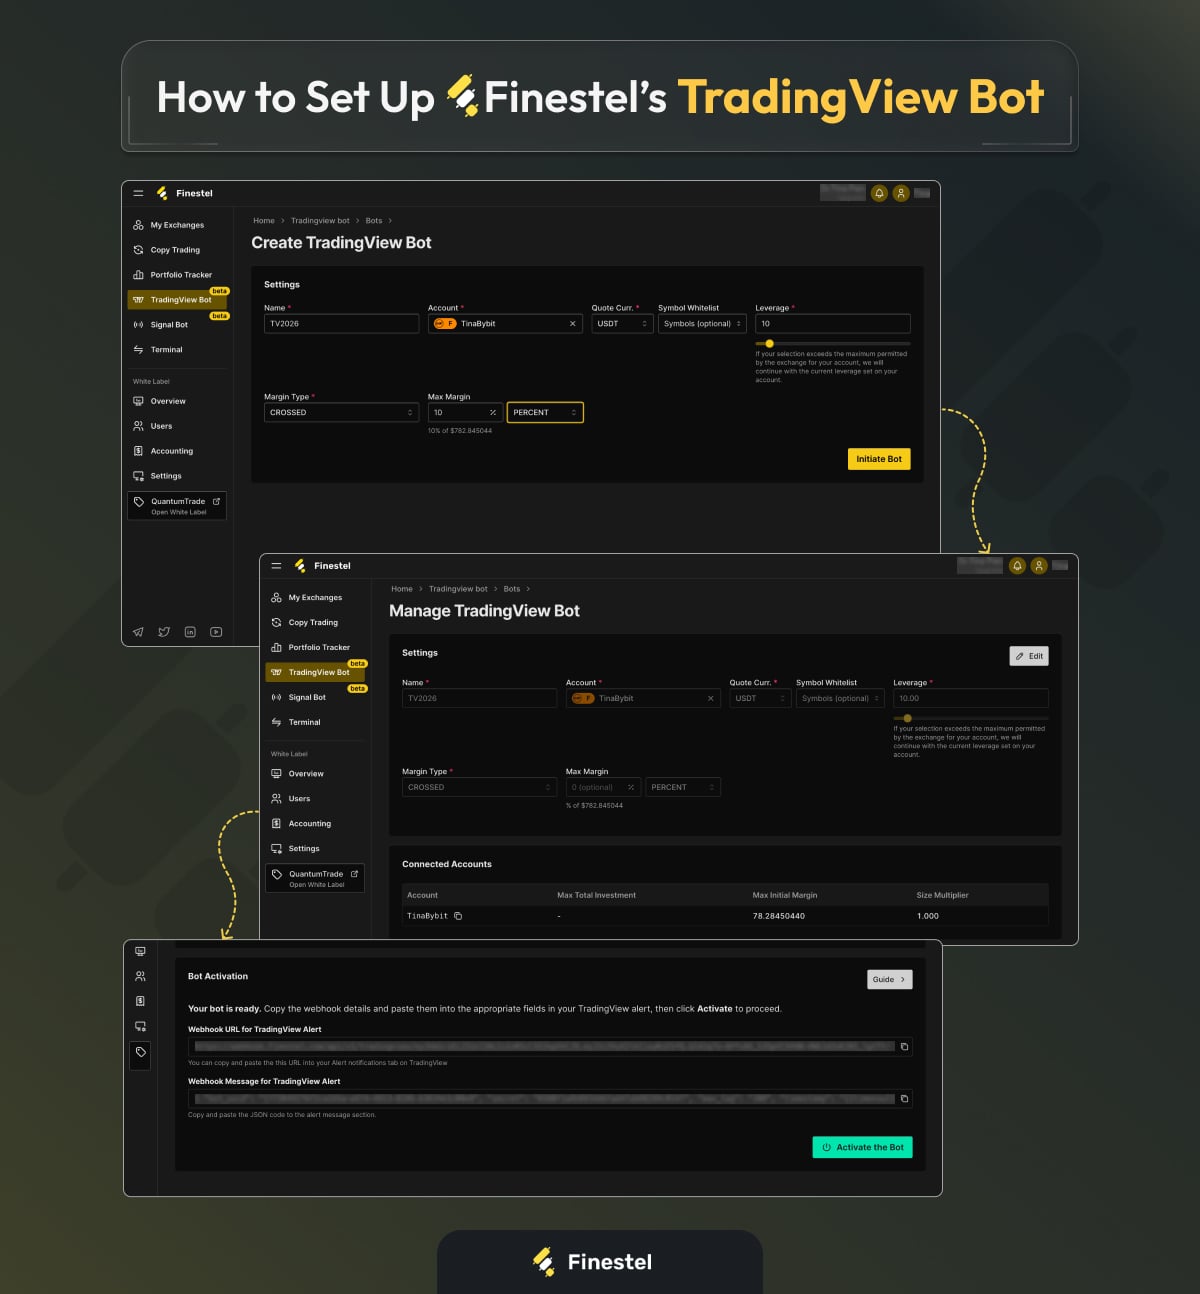
In the quest to streamline trading operations, Finestel has emerged as an innovative provider of TradingView automation solutions. Its specialized TradingView bot forms an integral part of Finestel’s comprehensive white-label service for traders and portfolio managers.
The Finestel TradingView bot seamlessly connects TradingView’s advanced analysis tools and custom strategies alerts to real-time order execution. By utilizing webhook API integration, the bot bridges the gap between TradingView’s charting capabilities and the execution powers of exchanges and brokers.
This combination empowers traders to design cutting-edge TradingView systems leveraging the best free indicators on TradingView, custom scripts, and risk management tools. The bot then handles order execution per the system’s alerts and signals.
By automating tedious manual processes, the Finestel TradingView bot enables efficient scaling while freeing up time for traders to focus on strategy. Its reliability, paired with Finestel’s stellar customer service, makes it a go-to solution for crypto traders and portfolio managers seeking real autotrading in TradingView.
As TradingView increases in popularity, Finestel stays ahead of the curve in providing innovative TradingView automation. Its bot unlocks the full potential of TradingView-based strategies.
Conclusion
No matter how many TradingView free indicators are out there, only a handful of them might be useful for you. There is also a TradingView free indicators limit on the charts based on your subscription plan. So, while the array of free indicators available on TradingView provides traders with invaluable tools to enhance analysis and unlock trading opportunities, you need to pick the best of the bunch. As we have explored, the best free indicators on TradingView across trend, momentum, volume, and other categories deliver objective insights and high-probability trade signals.
To further augment your TradingView strategy, solutions like Finestel’s auto trading bot seamlessly automate the execution process. Whether using fundamental indicators like moving averages and RSI or advanced tools like the AI Trend Navigator, traders gain an edge. Combining these indicators into a refined technical system filtered by prudent risk management pushes success rates higher. The best free indicators on TradingView highlighted in this guide represent those necessary for trading smarter in modern markets.
The Best TradingView Free Indicators in 2026 Infographic


How do I set up Trading View Free Buy Sell Indicator, thank you.
I’ve learn several good stuff here. Definitely worth bookmarking for revisiting.
I wonder how a lot effort you set to create this sort of magnificent informative content.
Hi
this is a great website for copy trading and creating white labels