In the fast-paced world of financial markets, traders seek strategies for a competitive edge. Correlation trading leverages relationships between financial instruments, offering unique perspectives on market dynamics and potential profitability. Cryptocurrency correlation traders can make informed decisions by exploring the statistical relationships between cryptocurrency prices and macroeconomic indicators.
This article by Finestel‘s blog talks about correlation trading in cryptocurrencies. The difference between correlation and causation in trading analysis, the types of correlations, and the significance of historical data will be explained. Then, we will study the correlation between cryptocurrencies’ prices, macroeconomic indicators, on-chain indexes, and the tools and indicators related to correlation trading. By the end of this article, you will understand how to navigate and profit from cryptocurrency volatility.
Understanding Correlation Trading
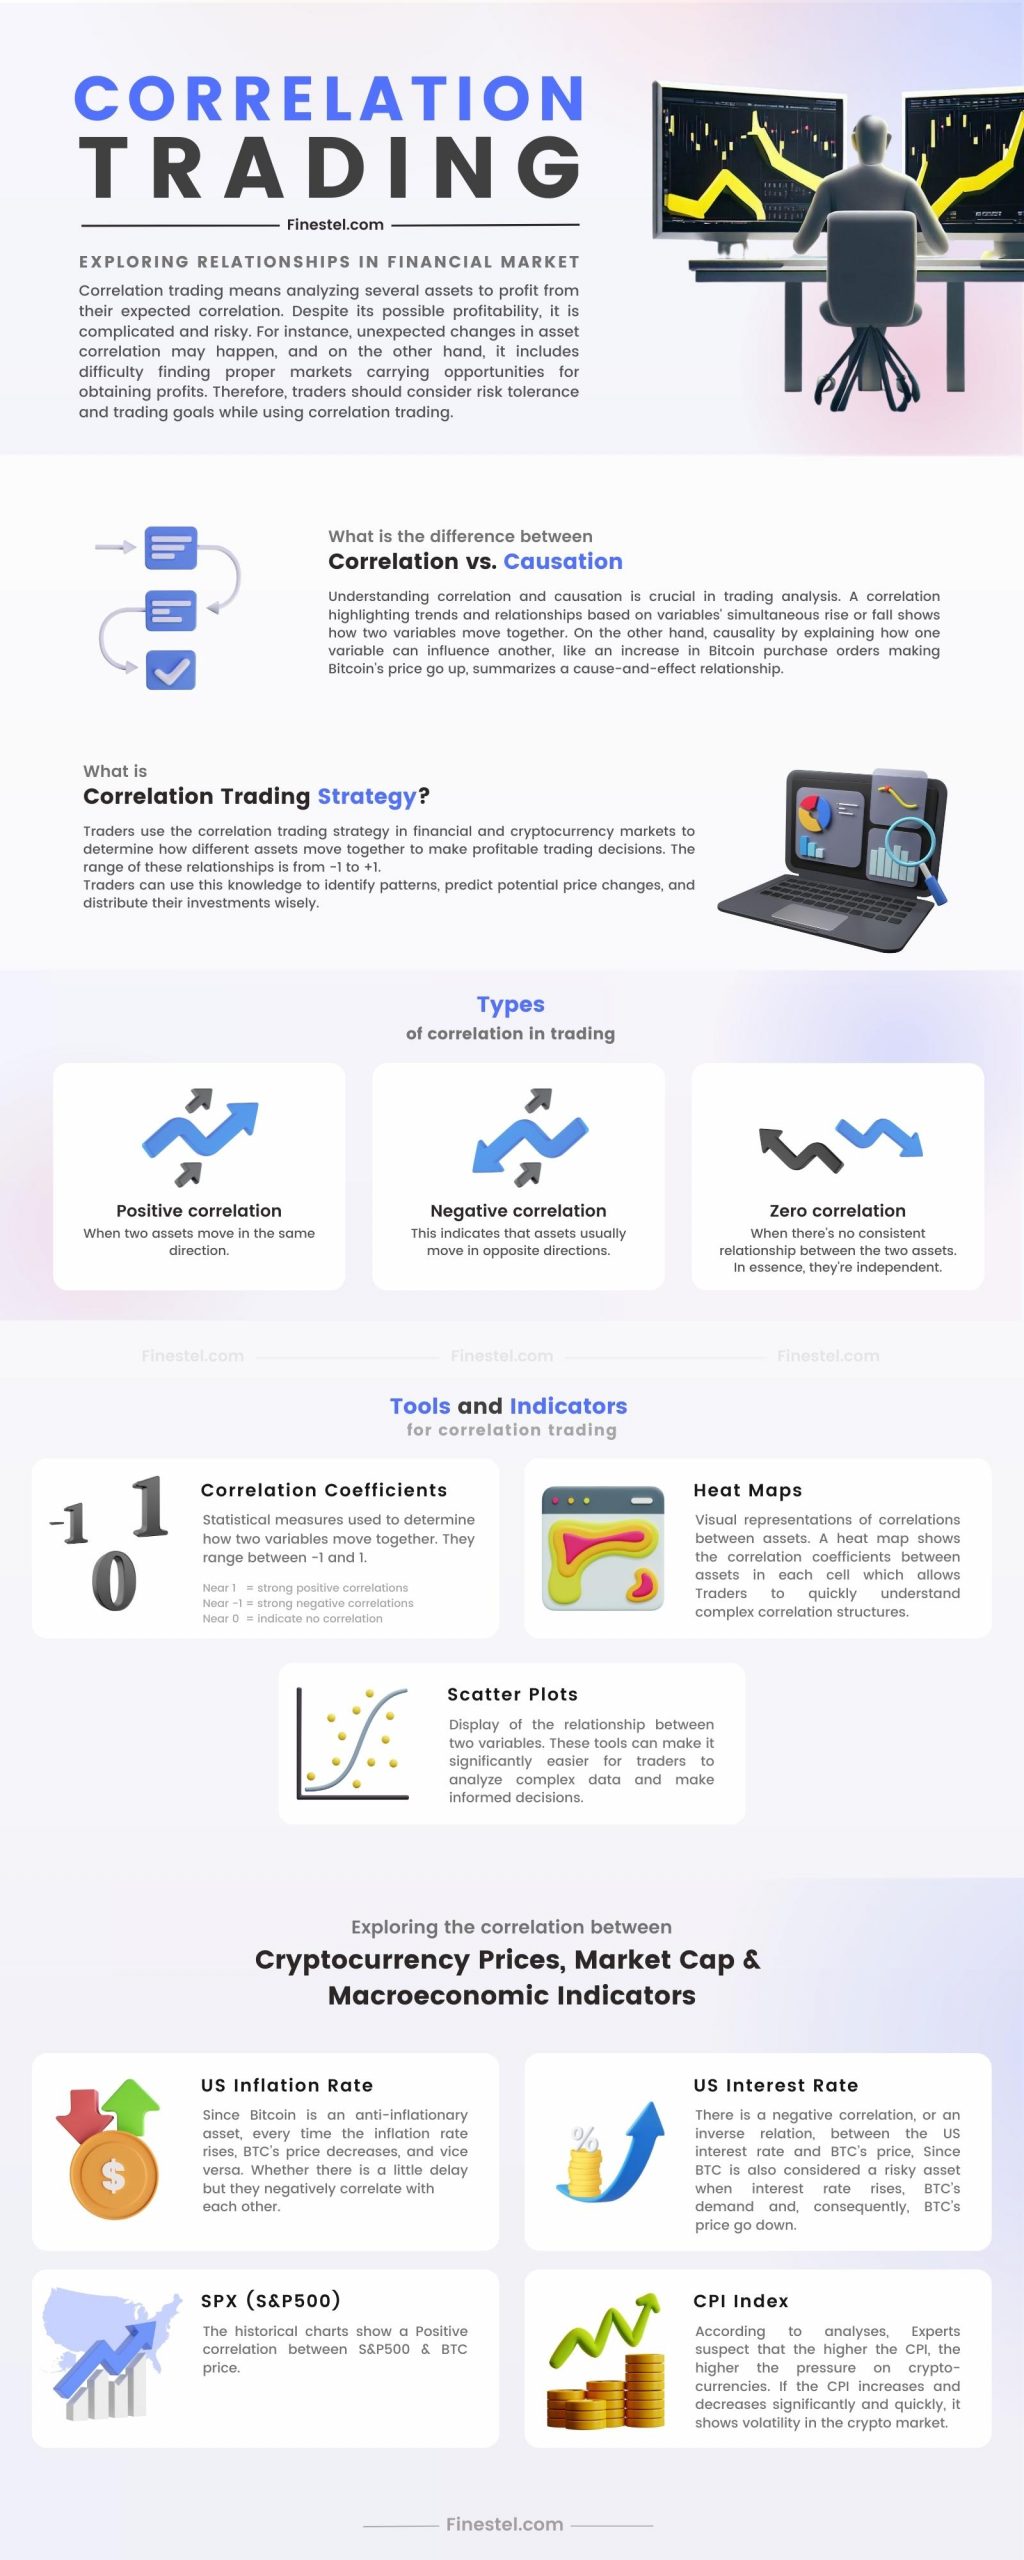
Correlation trading means analyzing several assets to profit from their expected correlation. Despite its possible profitability, it is complicated and risky. For instance, unexpected changes in asset correlation may happen, and on the other hand, it includes difficulty finding proper markets carrying opportunities for obtaining profits. 
Therefore, risk tolerance and trading goals are the factors that traders should consider while using correlation trading.
Read more about AI trading and discover the top AI trading bots in 2024.
Correlation vs. Causation: The Differences in Trading Analysis
Understanding correlation and causation is crucial in trading analysis. A correlation highlighting trends and relationships based on variables’ simultaneous rise or fall shows how two variables move together. On the other hand, causality by explaining how one variable can influence another, like an increase in Bitcoin purchase orders making Bitcoin’s price go up, summarizes a cause-and-effect relationship.
Even though they might exist together, correlation doesn’t mean the happening of causation. A third variable problem occurs when an invisible factor affects both variables and creates an uncaused correlation. Alternatively, the directionality problem arises when the cause-effect relationship is undefined and makes it harder to pinpoint which variable is causing the other to change.
By understanding these subtleties, traders can avoid jumping to conclusions based solely on correlations and better understand real-life relationships. As a result, traders can make more accurate forecasts and informed decisions, increasing their chances of making money.
What Is the Correlation Trading Strategy?
Traders use the correlation trading strategy in financial and cryptocurrency markets to determine how different assets move together to make profitable trading decisions. The degree of correlation between two instruments is determined by a coefficient ranging from -1 to +1.
Traders can use this knowledge to identify patterns, predict potential price changes, and distribute their investments wisely. But traders must remember that just because two assets move together, it doesn’t mean that their movement is causing the other. Understanding this concept helps traders make better decisions and avoid mistakes.
Types of Correlations in Trading: Positive, Negative, and Zero Correlations
Here are measures of correlation that come in three primary forms:
- Positive correlation: When two assets move in the same direction. A positive correlation means one asset rises or falls when the other does. A logical example would be similar stocks or cryptocurrencies with a harmonized value movement, such as Bitcoin and altcoins.
- Negative correlation: This indicates that assets usually move in opposite directions. If one asset’s value increases, the other will decrease, and vice versa. Gold and the US dollar are examples of negatively correlated assets. During times of high uncertainty, investors turn to ‘safe-haven’ assets like gold, bringing down the dollar’s value.
- Zero Correlation: This means there’s no consistent relationship between the two assets. Movements of one asset don’t affect others. In essence, they’re independent.
Note that these correlations aren’t fixed and can change over time due to market dynamics, economic trends, or geopolitical events. In volatile markets, traders swap assets with a positive correlation with those with a negative correlation. For traders, understanding these correlations is critical to making informed decisions, controlling risks, and crafting adaptable trading strategies.
Analyzing Historical Data: Uncovering Correlation Patterns in Crypto Markets
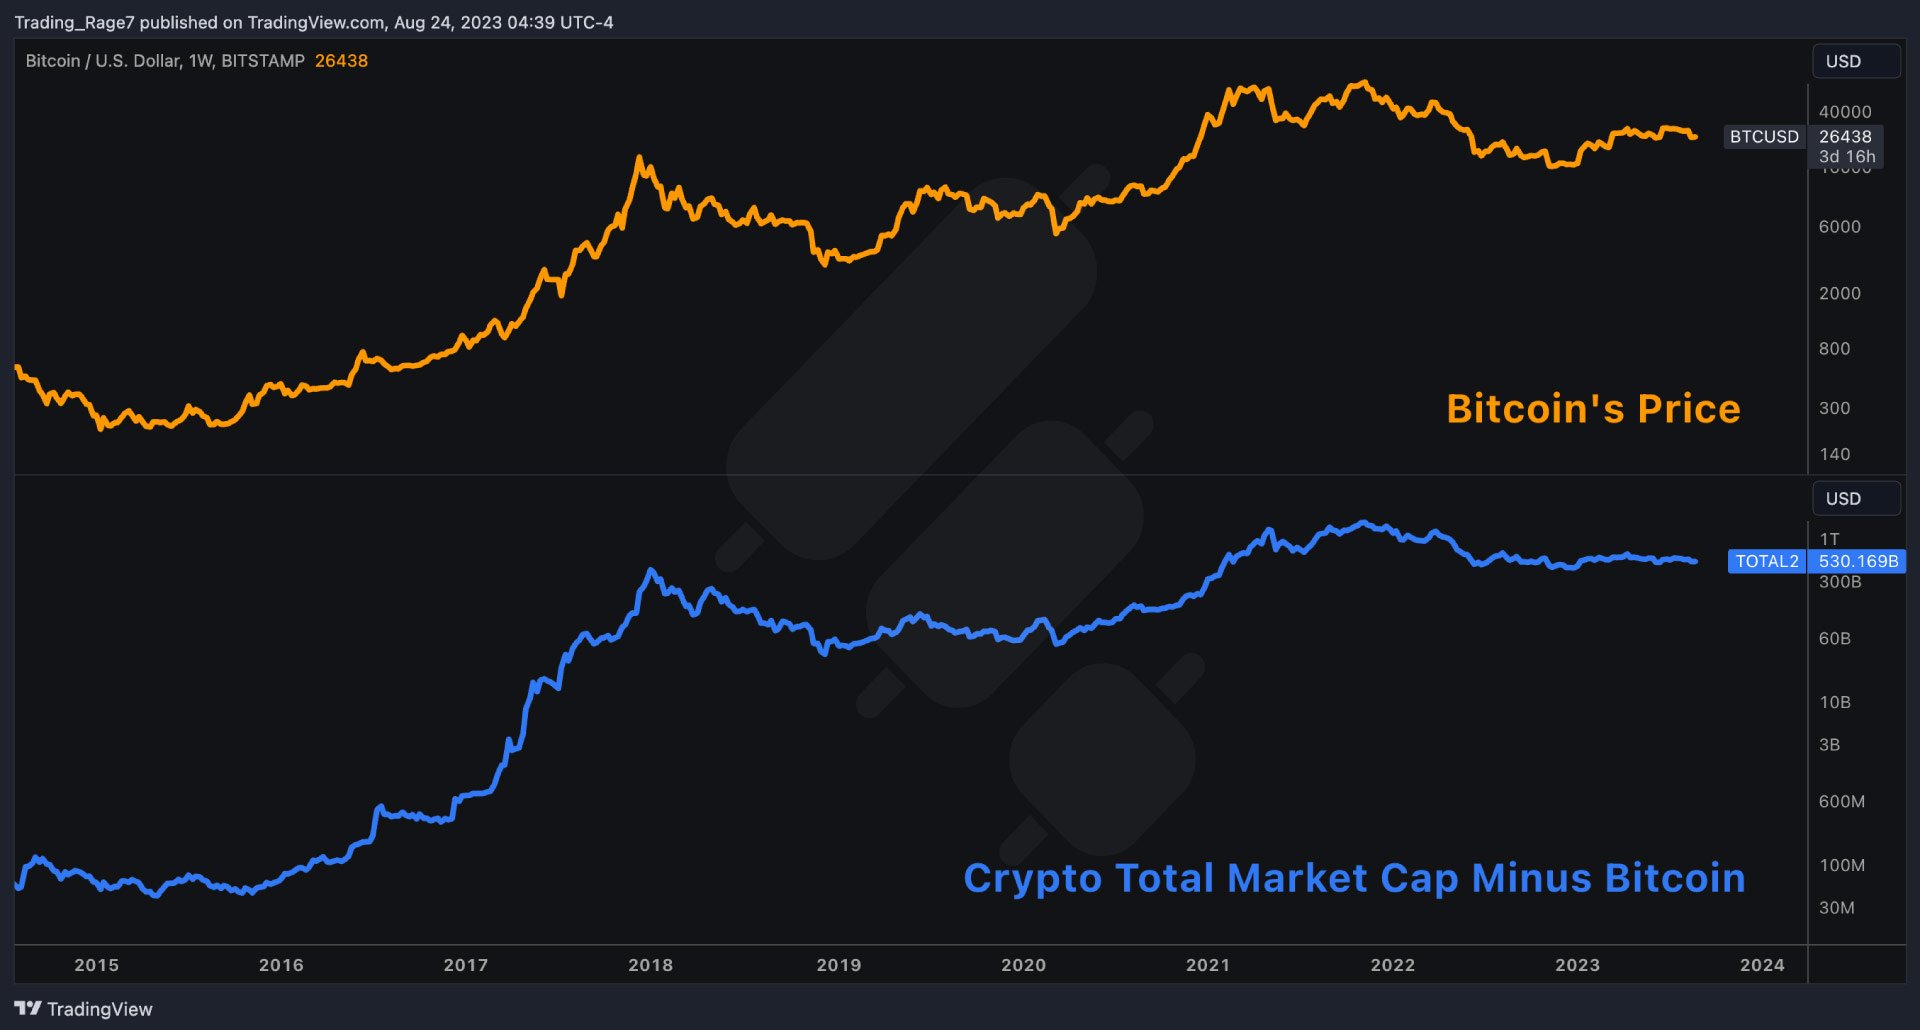
Most cryptocurrencies are correlated with each other; they mostly rise and fall together. Just like the stock, the overall market trend determines most individual stocks’ price action. The stock market’s trend is usually monitored via indices like the S&P500. Yet, in the crypto market, one individual asset determines the general direction of the market: Bitcoin.
Being the first-ever cryptocurrency, Bitcoin is the most prominent crypto in the world in terms of market capitalization. It currently comprises almost 50% of the whole crypto market. Therefore, as the king of cryptocurrencies, it is widely considered the primary index when it comes to evaluating the overall market trend. So, smaller cryptocurrencies usually follow Bitcoin’s price action. Yet, they are naturally more volatile than BTC because of their significantly lower market depth.
Furthermore, cryptos similar in function or created by the same organizations can also exhibit a considerable price correlation. Just like the stock market, the crypto market can also be divided into sectors, and tokens in the same sector are usually noticeably correlated.
Exploring the Correlation Between Cryptocurrency Prices, Market Cap and Macroeconomic Indicators
While many enthusiasts label crypto as an uncorrelated asset class to other traditional assets, the crypto market has demonstrated a completely different behavior. Some degree of correlation is evident between crypto and other assets like stocks and Gold.
Moreover, the cryptocurrency market has also been influenced heavily by the US economy and the Federal Reserve’s decisions. Specific correlated movements are visible between different macroeconomic metrics and the crypto market. Therefore, traders can use these correlations to identify trading opportunities.
There are two distinct asset categories based on their risk and reaction to various economic environments: risk assets and safe havens. Cryptocurrencies are widely known as risk assets, as they thrive when the economy is booming and crash when recessions hit or there is economic uncertainty. In the following sections, we provide evidence to back up this claim and demonstrate the correlation between the crypto market, the economy, and other markets.
Consumer Price Index (CPI)
The Consumer Price Index, or CPI, is one of the key macroeconomic metrics. CPI is the main inflation indicator used in the United States. It measures the changes in prices of consumer goods over specified periods. With inflation being one of the most critical issues in any economy, changes in CPI can affect the financial markets significantly.
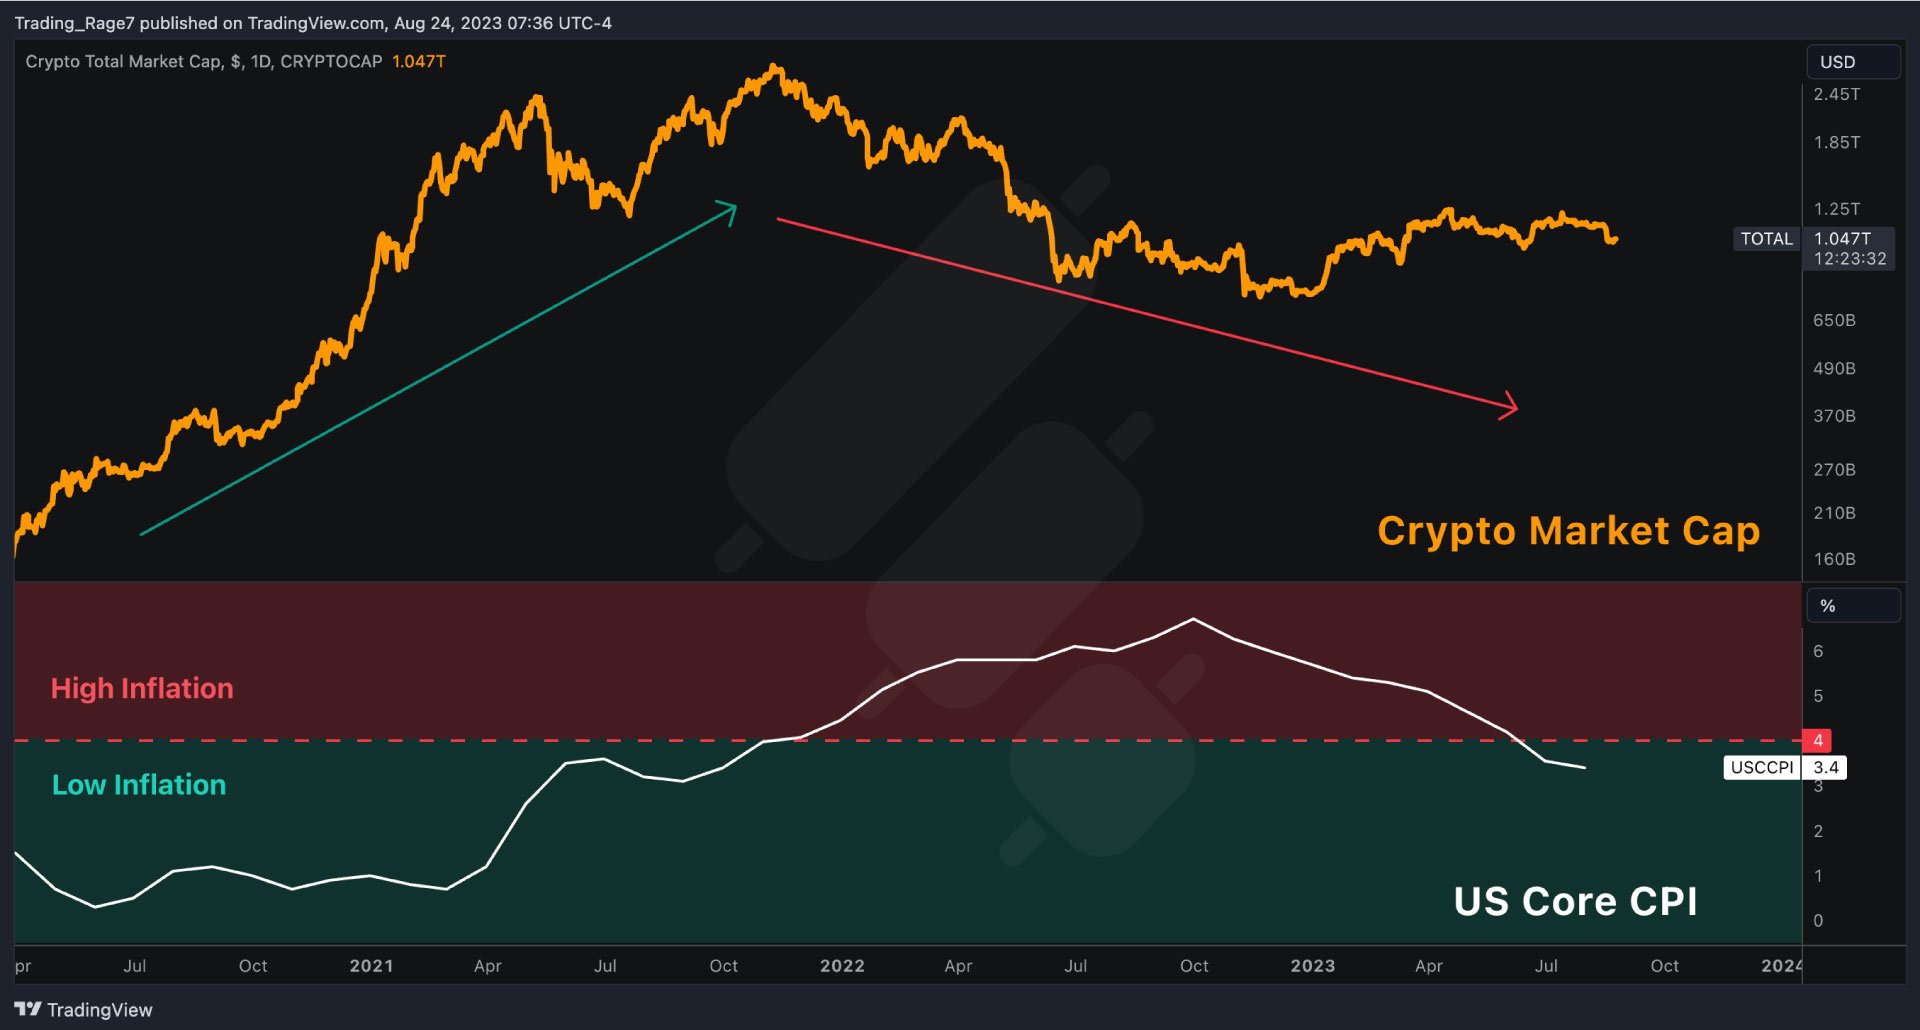
CPI values above 4% are typically considered high and indicate worrying inflation. As the chart above depicts, low CPI values are usually accompanied by a bull market in crypto, as the economy is stable and there are no worries that the Fed would raise interest rates to tackle inflation. On the other hand, high CPI readings are likely to increase the uncertainty in the economy, and considering that cryptocurrencies are risk assets, they are likely to experience losses in value. Therefore, there is a negative correlation between crypto and CPI.
Learn more about auto trading in TradingView.
Interest Rates
Generally, the interest rate is the amount a lender charges the borrower, expressed as a percentage of the borrowed money. However, by interest rates, we mean the Federal Funds Rate when discussing the economy. The Fed Funds Rates are the target range for interbank interest rates. It is the interest rate the commercial banks charge each other overnight when they lend money to one another.
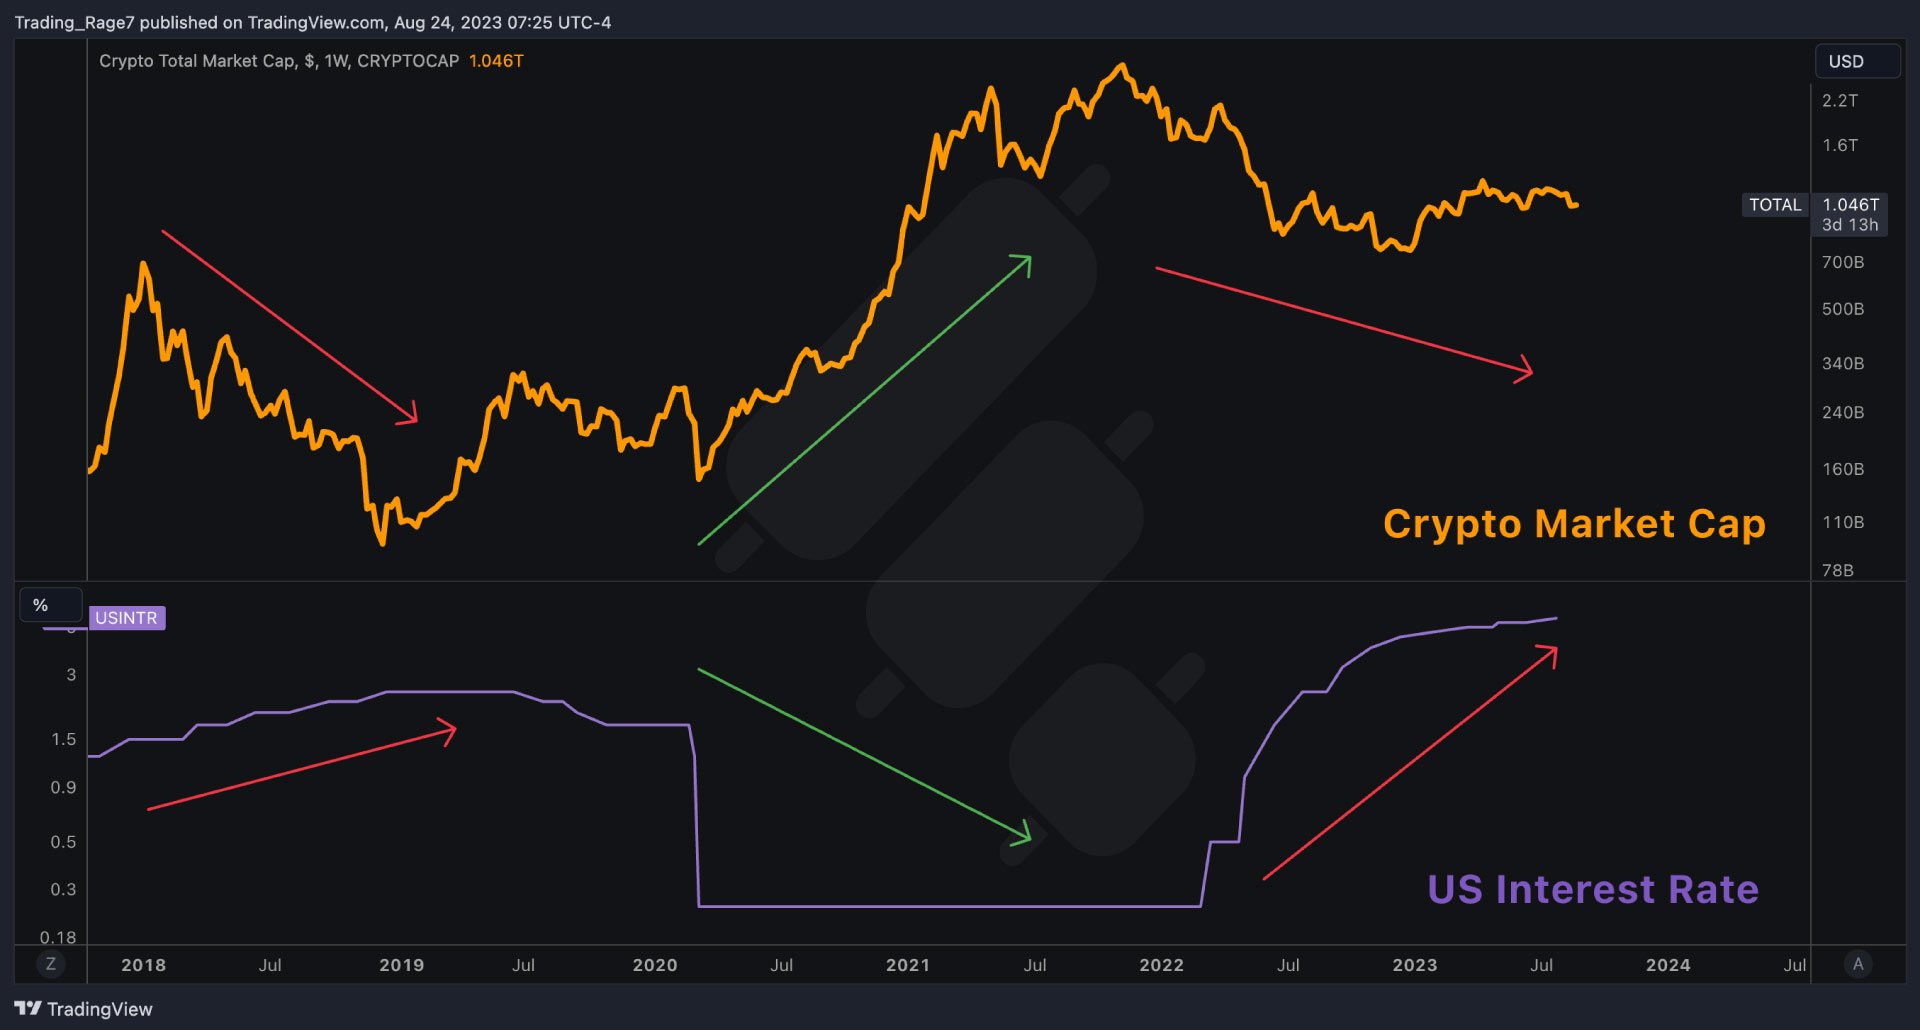
Interest rates are arguably the most influential tool the Fed has at its disposal to control the economy. Falling interest rates usually lead to market rallies as borrowing becomes cheaper. On the other hand, increases in interest rates often result in bear markets. as saving money with no risk becomes more attractive than investing in risky financial markets. As the riskiest financial asset class, the crypto market is highly affected by changes in interest rates, and the chart above clearly demonstrates the negative correlation.
S&P500
The S&P500 is the most significant stock market index in the US. It comprises the top 500 public companies traded on the New York Stock Exchange and the Nasdaq. The S&P500 is the most reliable index for evaluating the US stock market. As a result, it would be interesting to analyze whether it correlates with the crypto total market cap or not.
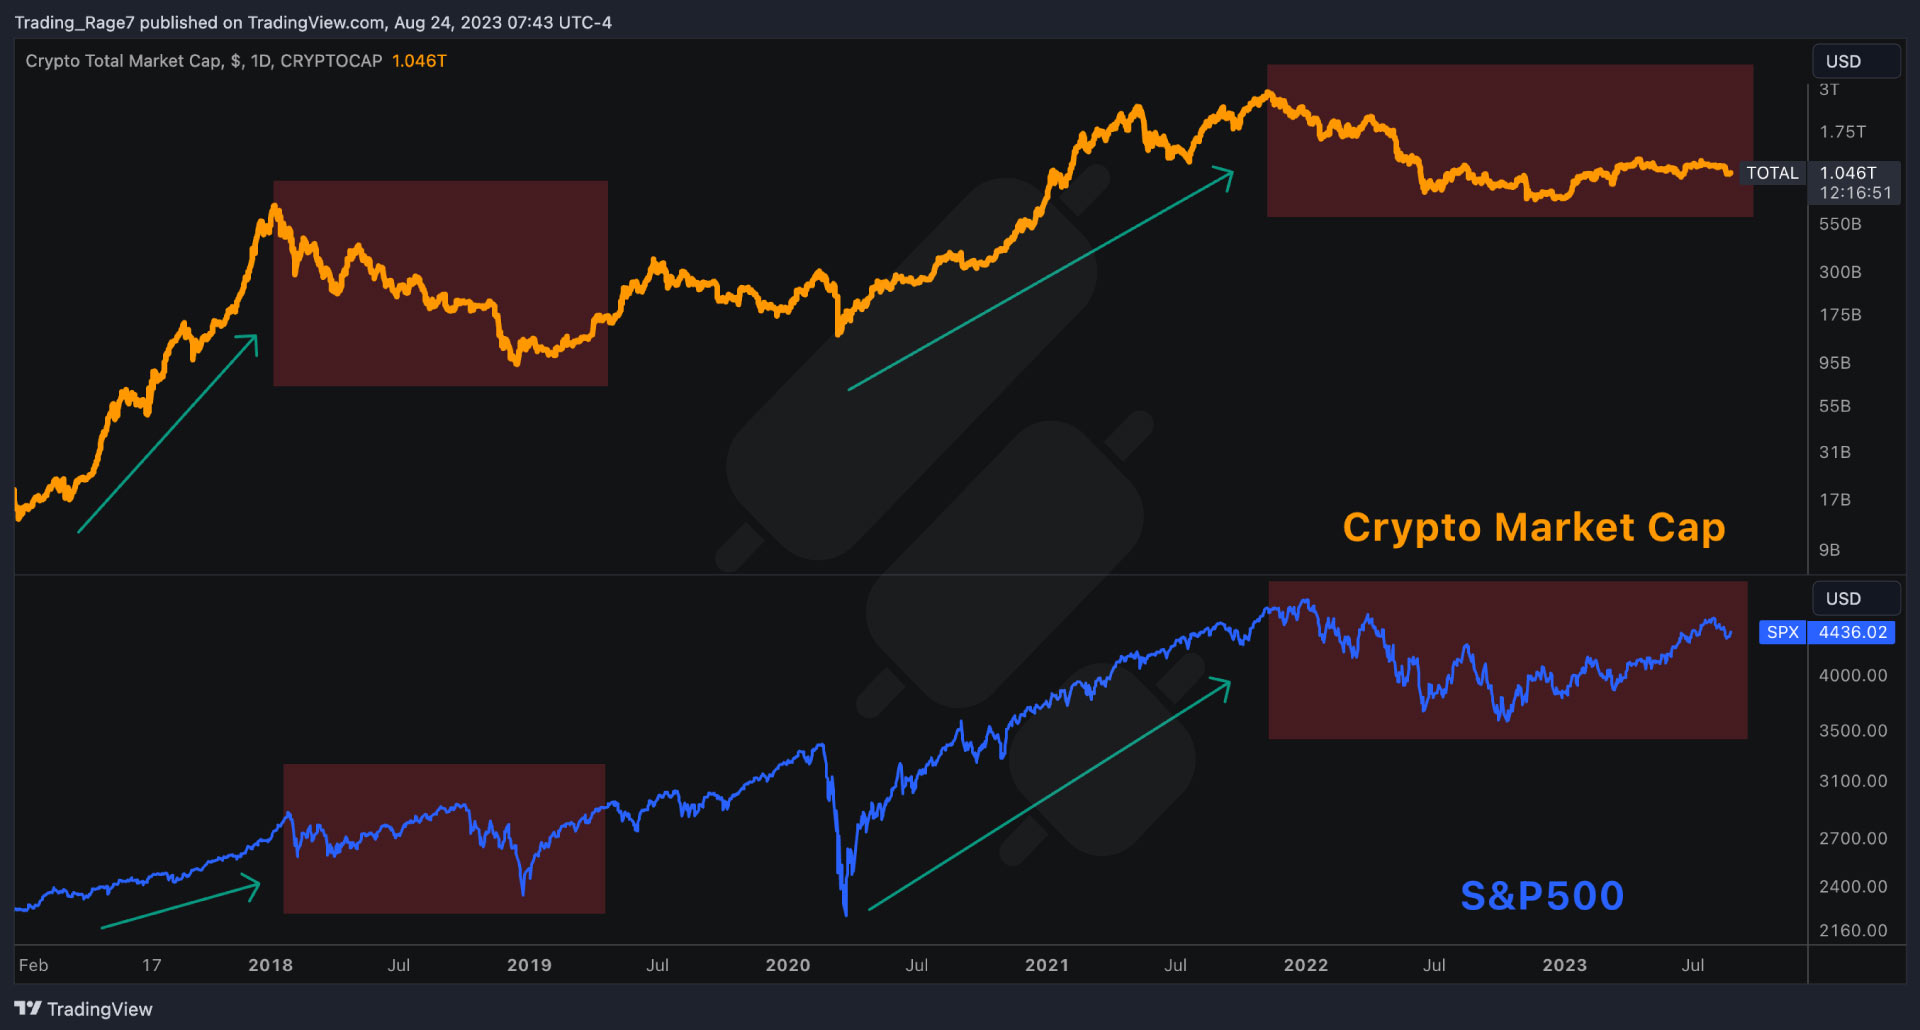
The chart above demonstrates a clear positive correlation between the S&P500 and the cryptocurrency market. Both stocks and cryptos are risk assets, as they rally in stable economic environments and decline in recessions and uncertainties. Clearly, these markets behave very similarly, showing a positive correlation with each other.
Gold
Gold is one of the oldest financial assets in the world. It has long been used as money, but nowadays, it is mainly a safe haven asset and a hedge against inflation for the long term. So, Gold and crypto should demonstrate a negative correlation as the cryptocurrencies are risk assets and should behave oppositely.
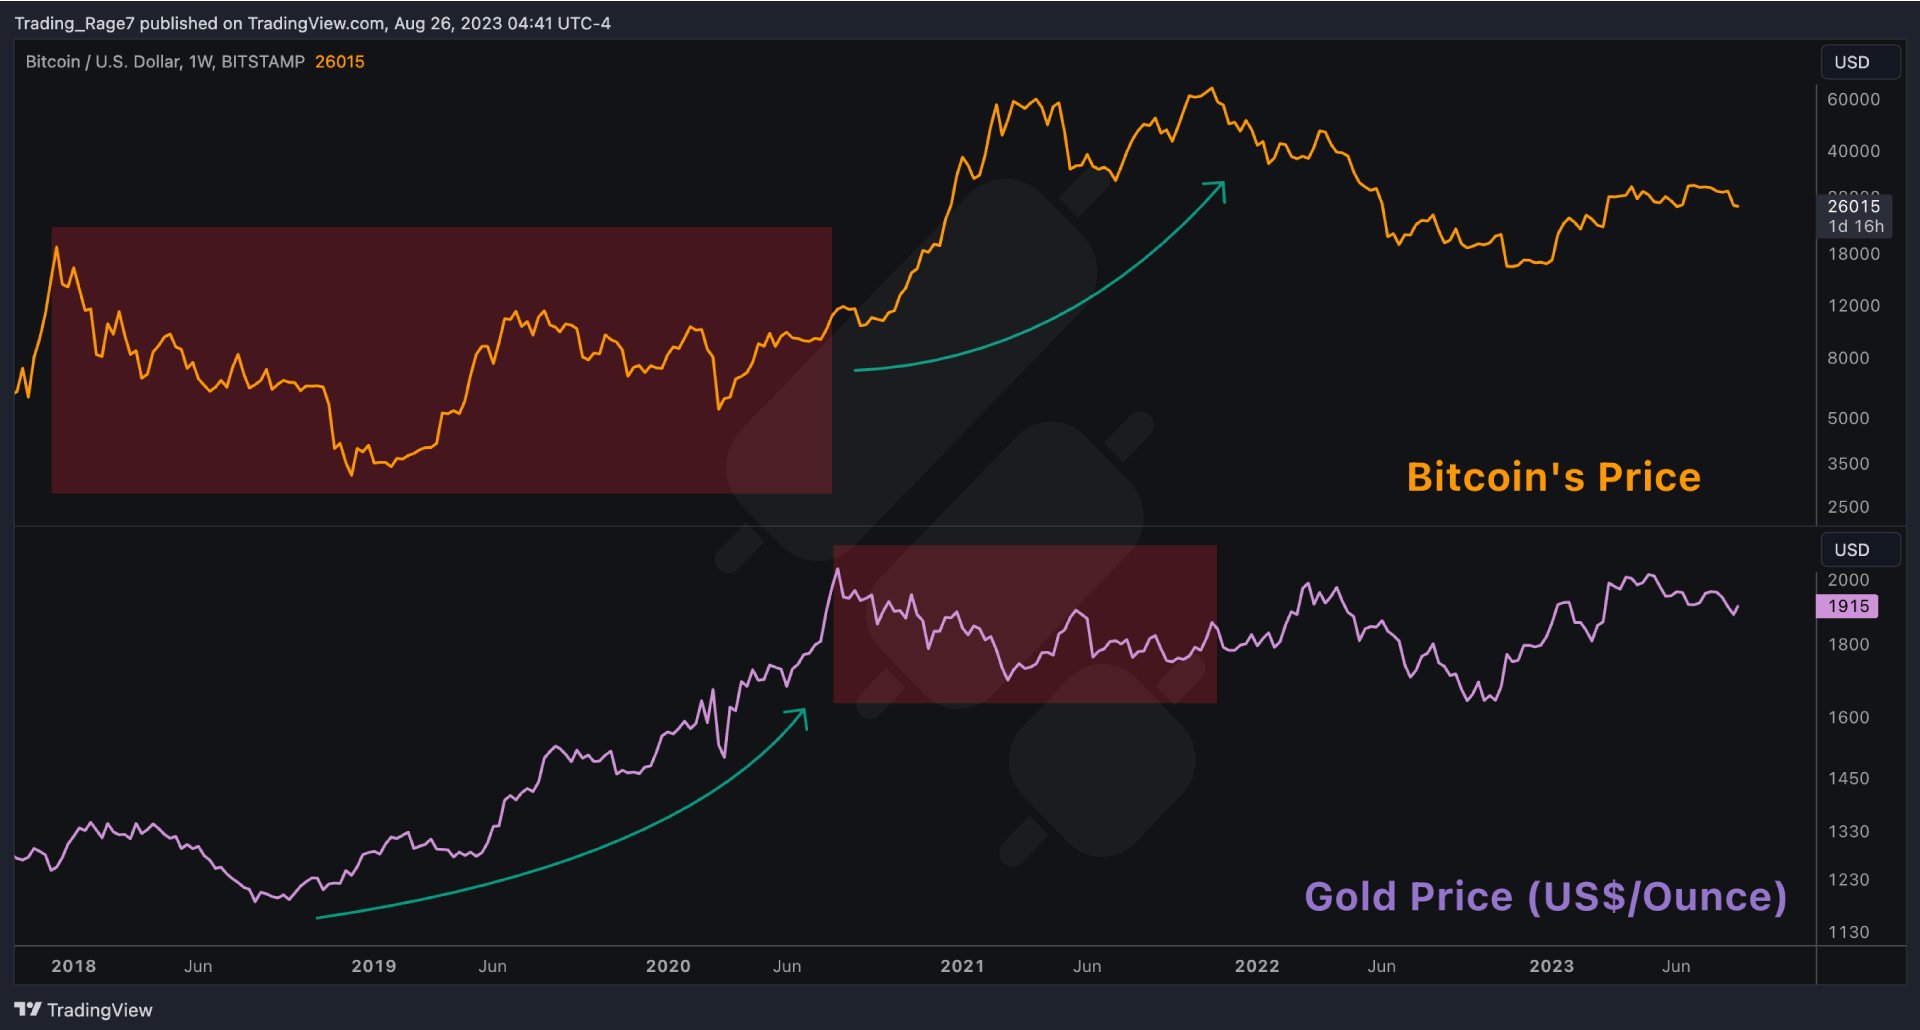
To evaluate this correlation, we compare Gold to Bitcoin, known as digital gold. It is evident that over the last few years, Bitcoin and Gold demonstrated totally opposite price actions. During the 2018-2020 Gold bull run, Bitcoin was experiencing a gruesome bear market. On the other hand, during the 2020-2021 Bitcoin bull market, Gold prices were on the decline.
Yet, it is notable that these two assets have been showing relatively similar price moves since the beginning of 2022. The reason might be that Bitcoin is finally transitioning into a safe haven asset, as the digital gold narrative suggests. However, it is still too early to draw this conclusion, as we require more data.
Tools and Indicators for Correlation Trading
Correlation trading requires specific tools and indicators to measure and visualize the relationships between different assets accurately. Some of the most commonly used ones are:
- Correlation Coefficients: These are statistical measures used to determine how two variables move together. A correlation coefficient ranges between -1 and 1. When they are close to 1, they indicate strong positive correlations, whereas close to -1, they indicate strong negative correlations. And, of course, correlation coefficients near 0 indicate no correlation.
- Heat Maps: These are visual representations of correlations between assets. A heat map shows the correlation coefficients between assets in each cell. Traders can quickly and intuitively understand complex correlation structures by observing the color intensity in each cell.
- Scatter Plots: A scatter plot displays the relationship between two variables.
These tools can make it significantly easier for traders to analyze complex data and make informed decisions. Despite the strength of these tools, traders must continually update and refine their analyses in response to market changes to maintain a strong understanding of correlations.
Conclusion
Correlation trading is an effective tool in cryptocurrency trading. By understanding the relationship between trends of different assets, traders can reach an informed point of view for their analysis. Unlike traditional asset evaluators, this can go beyond individual assets. It’s important to understand that correlation doesn’t mean causation, which prevents mistaken decisions. In addition to using correlation coefficients, heat maps, and scatter plots, traders can use these tools to visualize these complex relationships.
Correlation trading has many benefits. By implementing this strategy, traders can make more informed decisions about their portfolios, manage their risks better, and make more money. Whether you’re detecting patterns in historical data, recognizing macroeconomic indicators, or monitoring on-chain indexes, correlation trading gives you a better view of the volatile cryptocurrency market.
Correlation Trading Infographic
Correlation Trading Infographic
FAQ
What is the correlation in trading?
Correlation means the meaningful alignment of the trend of two assets moving with each other. When it is +1 it means that there is a perfect positive correlation, and when it is -1 it means that there is a perfect negative correlation, and 0 means no correlation.
Which stocks are correlated to crypto?
Due to their direct investments, stocks like MicroStrategy, Tesla, and Square have shown correlations with cryptocurrencies, particularly Bitcoin. Despite this, correlation varies over time and is influenced by market sentiment and regulatory news.
Can correlation analysis help in predicting the price movements of cryptocurrencies?
Yes, correlation analysis can assist in predicting the price movements of cryptocurrencies. Traders use it to predict price changes, manage portfolio risk, and make strategic investments. However, it should be part of a broader analysis toolkit since correlation does not imply causation.
Is the crypto market correlated to the stock market?
In the past, cryptocurrency markets have been independent of traditional financial markets, but periods of increased market stress have shown temporary correlations. Since these correlations are unstable and can shift quickly, the crypto market is generally seen as a separate asset class.


Leave a Reply