Among the many trading strategies deployed in financial markets, mean reversion has emerged as a popular approach for traders across various assets and timeframes. Mean reversion trading aims to capitalize on the tendency of prices to revert back toward their historical averages after substantial upward or downward movements. The core concept in this trading strategy; mean reverting, is that extreme price deviations are often corrected eventually.
In this article by Finestel, we will explore the ins and outs of mean reversion trading. We begin by defining what the strategy entails and how traders seek to profit from it. We then highlight some of the advantages that mean reversion strategies offer in markets, along with their limitations. Finally, we provide an overview of some common trading techniques used to implement mean reversion and key considerations for applying them effectively. While no strategy is flawless, understanding the mean reversion strategy and its nuances can potentially enhance a trader’s arsenal and opportunities.
What Is Mean Reversion Trading?
Mean reversion trading is when you trade based on the idea that prices eventually go back to their historical average (mean reverting). The core concept of this strategy is that extreme price moves don’t last forever. If a price goes way higher or lower than usual, it is likely to come back to its regular level at some point.

In order to implement the mean reversion trading strategy, you should look for overbought or oversold assets (compared to their historical average). If the asset is overbought, you should take a short position, betting it will drop back down. On the contrary, if is oversold, you should go along with the expectation that it will bounce back up. Your target for mean reverting would be the historical average price.
The goal is to profit when the price reverts to its mean. You should wait for the price to display an extreme movement. Then, you should expect it to correct back to equilibrium. This strategy assumes that wild price swings are not sustainable and averages win out over time.
Advantages of Mean Reversion Trading
One of the key advantages of mean reversion trading is that it relies on the belief that asset prices will eventually revert to their historical averages. This concept provides traders with a clear framework for identifying potential opportunities.
You can capitalize on temporary mispricings by targeting assets that have deviated significantly from their mean. This mean reversion strategy aligns with the idea that extreme price movements are often followed by a correction (something clearly evident on price charts).
Additionally, mean reversion trading can be attractive because of its compatibility with various financial instruments and timeframes. This strategy can be applied to stocks, currencies, commodities, cryptocurrencies, and other assets. It offers a versatile approach for traders across different markets.
Last but not least, the mean reversion strategy is typically used with indicators and has a straightforward framework. Therefore, there is a wide range of mean reversion algo trading strategies. The reason is that you can easily code it and turn it into an algorithm. So, with mean reversion trading, you have a strategy that can be automated conveniently. This is a huge plus for traders and developers seeking to create mean reversion algo trading strategies.
Finestel can offer various automated solutions for mean reversion algo trading. We offer several services like trading bots, copy trading, and other trading automation tools to help traders elevate their performance and even perform asset management for investors. You can take a look at our copy trading service here.
Disadvantages of Mean Reversion Trading
The problem with mean reversion trading is that it is hard to get the timing right on when a price will actually bounce back to its average. Markets can stay overbought or oversold for a long time before mean reverting. You may miss opportunities or lose money waiting for the reversal. Prices don’t always snap back as expected.
Additionally, significant events or sudden market moves can cause prices to trend strongly in one direction, away from their mean. News events, political issues, or changes in market sentiment can mess up mean reversion trades. False signals also happen. The price might look like beginning a reversal, but it can actually be part of a bigger trend.
Liquidity can also make mean reversion trading tricky. With assets that are not traded frequently, it is hard to enter and exit at the prices you want. Wide bid-ask spreads eat into profits, too. You might identify a reversal setup but struggle to execute it in an illiquid market.
Moreover, the strategy depends on past price behavior happening again. But markets evolve, and the dynamics can change over time. Historical data might not work as well anymore. Traders have to adapt their strategies, which adds complexity.
You should understand markets well enough to trade reversions without getting burned by extended trends or fakeouts. Risk management and backtesting are key with this strategy since the price might not revert as fast as you expected. So, while mean reversion seems simple, timing it right in the real markets can be challenging.
What is the Best Mean Reversion Strategy?
As already mentioned, mean reversion strategies aim to capitalize on the tendency of asset prices to revert to their historical averages. While each mean reversion trading strategy has its own benefits and drawbacks, there are a few that stand out. Here are some of the optimal mean reversion trading strategies:
1. Moving Averages
One of the simplest mean reversion strategies involves using moving averages. Traders often look for situations where the current price deviates significantly from a moving average.
For example, a trader might consider an asset to be overbought if its current price is well above its 100-day moving average and oversold if it is well below. You can then enter positions based on these deviations. Your expectation will be that the price will revert to the moving average. Note that the moving averages can also be used for mean reversion day trading strategies, as their periods are not necessarily in days, making it a simple intraday mean reversion strategy.
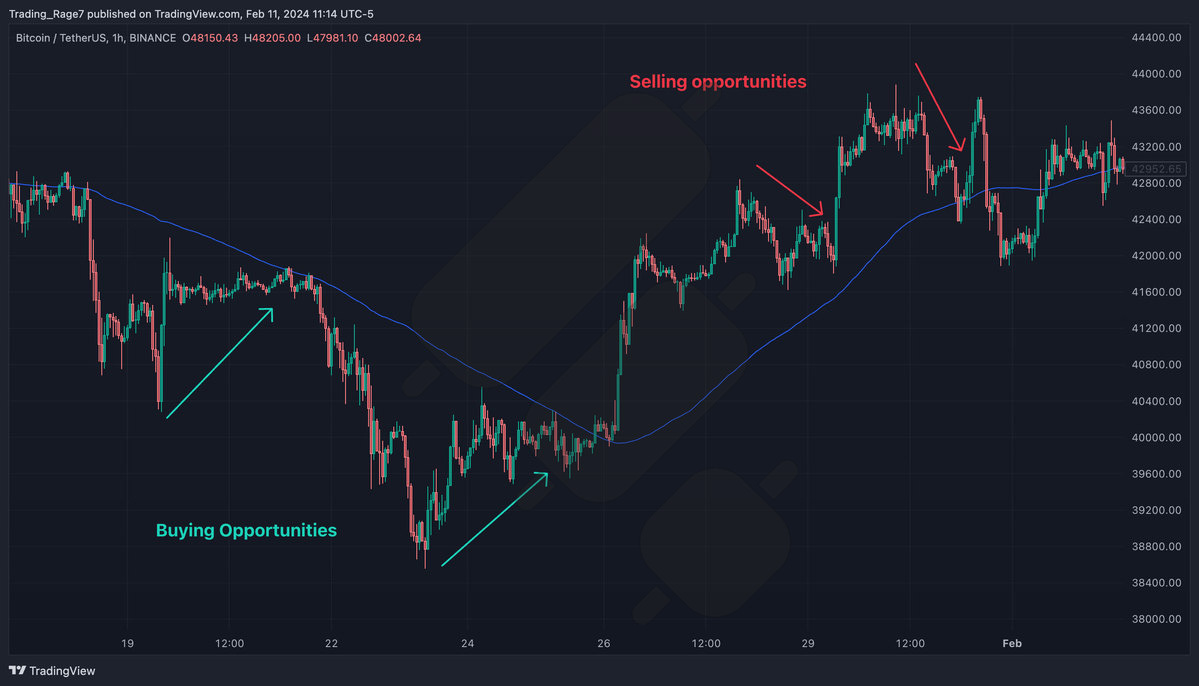
We will illustrate the first mean reversion strategy example on the Bitcoin TradingView chart above. It is evident that the price has deviated from its 100-day moving average multiple times. You can use these extreme movements away from the mean to capitalize on their reversions. Moreover, you can also utilize moving averages to create strategies combining trend following and mean reversion.
2. Bollinger Bands
Commonly known as the best mean reversion strategy, the Bollinger Bands consist of a middle band, which is a simple moving average, and two outer bands representing standard deviations from the mean. Traders using Bollinger Bands look for instances where the price has moved beyond the outer bands, signaling potential overbought or oversold conditions.
The expectation is that the price will revert towards the middle band. So, you should look for opportunities to long or short with your mean reverting target set at the middle band. Again, the Bollinger Bands can also be used for creating mean reversion day trading strategies.
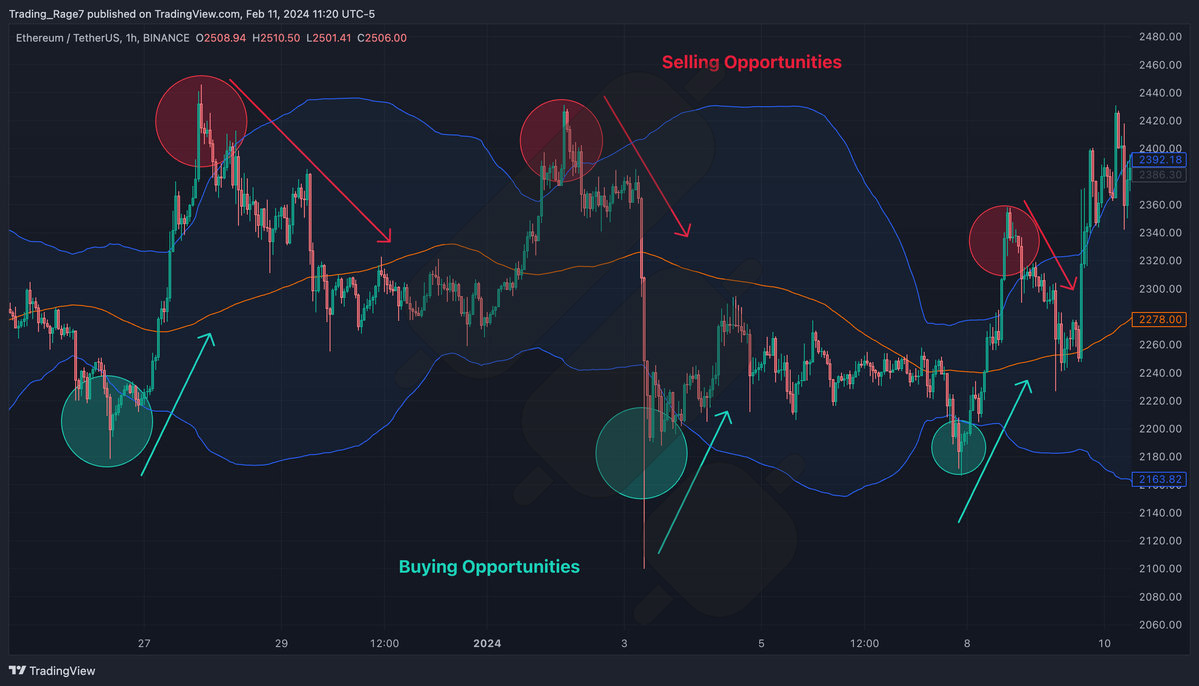
The abundance of opportunities is one of the reasons that the Bollinger Bands strategy is considered the best mean reversion strategy. As the Ethereum chart above demonstrates, ETH’s price has been constantly moving outside the Bollinger bands. Yet, each time, the price has reverted to the middle band.
When the price breaks above the higher band, you can use it as an opportunity to go short. On the other hand, when the price falls below the lower band, you can buy with the expectation of a reversion toward the mean. The Bollinger Bands are also utilized regularly for combining trend following and mean reversion, similar to moving averages.
3. Relative Strength Index (RSI)
This one is mostly a mean reversion day trading strategy. The RSI is a momentum oscillator that measures the speed of price movements. A high RSI reading suggests overbought conditions, while a low RSI reading indicates oversold conditions.
Traders using RSI for mean reversion look for divergence between the RSI and price movements, anticipating a reversal back towards the mean. You can also look for opportunities when the RSI enters overbought (above 70%) or oversold (below 30%) regions.
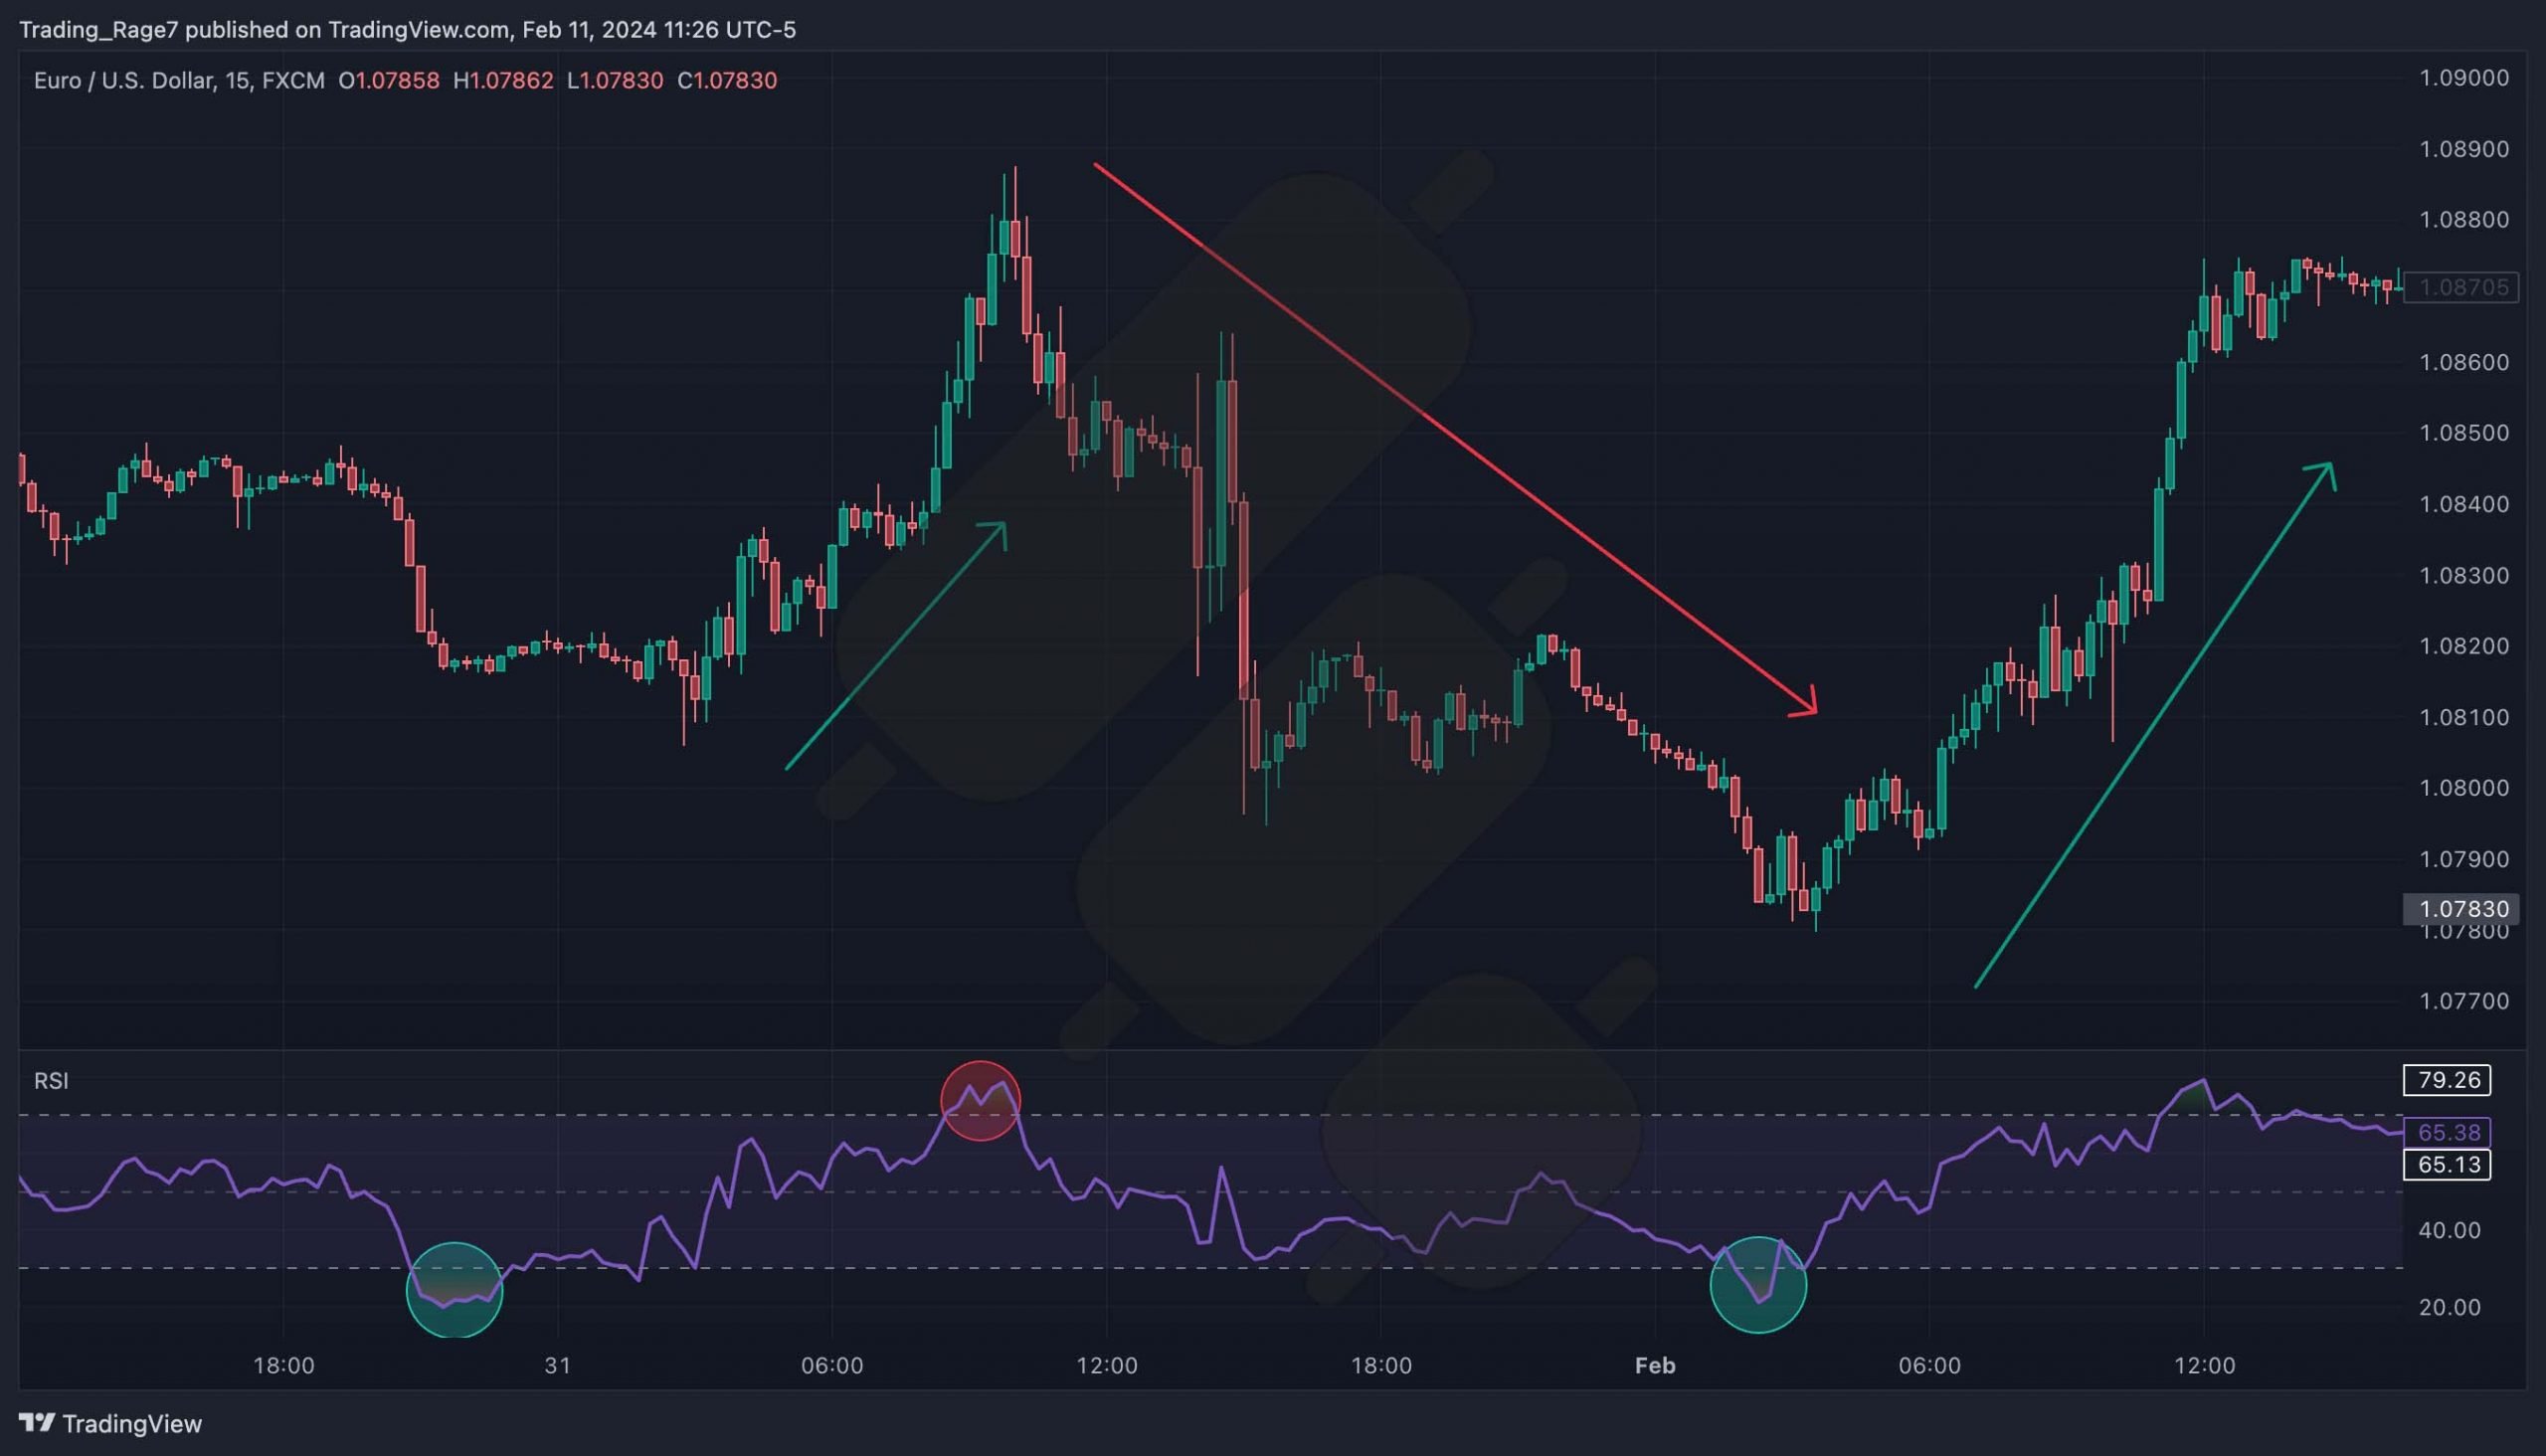
For another mean reversion strategy example, look at the EUR/USD chart above. The price has entered the overbought region once and the oversold region twice. In this intraday mean reversion strategy, you could have taken long or short positions accordingly to profit from the price’s reversion. As with the last two indicators, the Relative Strength Index can also be included in a strategy combining trend following and mean reversion.
4. Pairs Trading
Pairs trading involves identifying two correlated assets and taking positions based on their relative performance. When the prices of the two assets deviate from their historical relationship, traders may enter a long position in the underperforming asset and a short position in the outperforming one, expecting a convergence. This is one of the most optimal mean reversion trading strategies for higher timeframes.
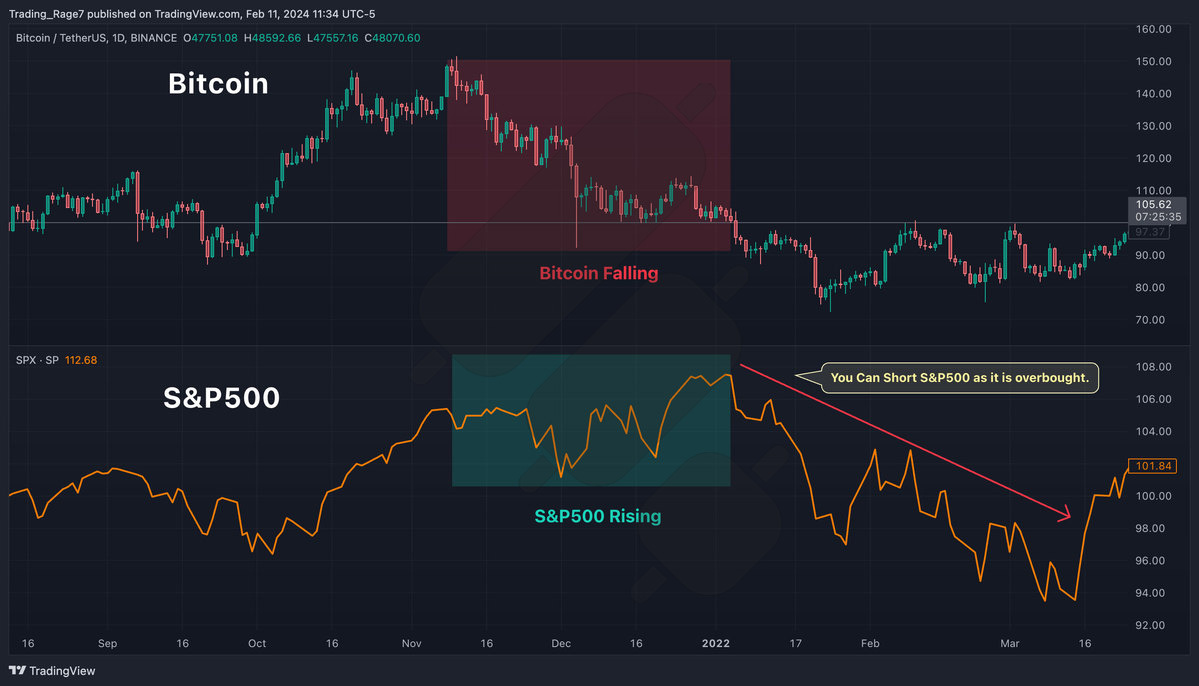
The chart above demonstrates another mean reversion strategy example. It depicts the prices of Bitcoin (top) and the S&P 500 index (bottom). These pairs have been showing strong correlations over the past couple of years. For example, as the chart demonstrates, there was an instance when Bitcoin’s price began to fall while the S&P 500 was still rising. This created a decent opportunity for traders to short the S&P 500, as it was overbought compared to BTC.
Market Making and Mean Reversion: What are the Differences?
Market making and mean reversion are different trading strategies with their own goals. Market-makers provide buy and sell quotes to create liquidity, aiming to profit off the bid-ask spread. They adjust quotes based on market conditions and manage risk by buying low and selling high. 
Mean reversion traders bet that prices will revert to historical averages after big moves up or down. They identify assets that have deviated a lot from the mean price and take positions expecting the price to correct back toward its average.
Meanwhile, market making and mean reversion can unite in algo trading. Some market making algorithms use mean reversion concepts to adapt quotes to the market. For example, the algorithm may tweak its pricing based on how much the current price deviates from the historical average. This helps optimize its strategies and inventory management.
But overall, market making is about liquidity and spread capture, while mean reversion aims to capitalize on deviations from averages. The goals are different even if some algorithms blend both strategies. Understanding the core purpose of each is important.
Conclusion
In this article by Finestel, we focused on the concept of mean reversion trading. We explained what it is, how it is implemented, and what some of its benefits and limitations are. We also introduce some mean reversion strategy examples to familiarize you with how it is done. Finally, we analyzed the differences between mean reversion trading and market-making strategies.
Mean reversion trading aims to profit from prices reverting to historical averages after extreme moves. The premise is prices cannot deviate too far from the mean permanently. While this strategy has merits like a defined framework and versatility across assets and timeframes, executing it well faces hurdles. Timing entries and exits are challenging as reversals occur slowly in real markets. Moreover, adaptability is required as market dynamics change over time.




Leave a Reply